
The Dow Jones Industrial Average (DJIA), often simply referred to as “the Dow,” stands as one of the most enduring and frequently cited financial benchmarks in the world. For over a century, its movements have served as a critical barometer for the health of the U.S. stock market and, by extension, the broader American economy. From the bustling trading floors of Wall Street to casual conversations around kitchen tables, the phrase “the Dow is up” or “the Dow is down” instantly conveys a snapshot of economic sentiment. Yet, few truly understand the incredible journey this index has undertaken—how it evolved from a simple average of a dozen industrial companies into the sophisticated, influential indicator it is today. Understanding the genesis and evolution of the Dow is not merely an academic exercise; it offers profound insights into the economic forces that have shaped modern capitalism, investor psychology, and the very structure of our financial lives. It’s a story of innovation, resilience, adaptation, and an unwavering commitment to making complex market dynamics accessible to the everyday person.

The Genesis of an Icon: From Railroads to Industrial Might
The story of the Dow Jones Industrial Average is intrinsically linked to the quest for clarity in an increasingly complex financial landscape. In the late 19th century, as industrialization swept across the United States, investors and the public alike lacked a reliable, easily digestible measure of market performance. It was amidst this need that a pioneering vision took root, laying the groundwork for what would become an indispensable financial tool.
Charles Dow’s Vision and the Birth of Averages
The intellectual architect behind the Dow was Charles Dow, a visionary financial journalist and co-founder of Dow Jones & Company with Edward Jones and Charles Bergstresser. Dow believed that a true measure of the market’s direction could be found by averaging the prices of key stocks. His initial foray into market averages began in 1884 with the “Dow Jones Railroad Average,” comprising just 11 stocks, nine of which were railroads—the dominant industrial force of the era. However, as the American economy diversified beyond rail, Dow recognized the need for an index that better reflected the broader industrial growth. This led to the creation of the Dow Jones Industrial Average, officially launched on May 26, 1896. This new index captured the dynamism of emerging sectors like sugar, tobacco, and steel, marking a pivotal shift towards a more comprehensive economic indicator.
The Original Calculation and Early Constituents
When it debuted, the DJIA was a remarkably simple construct: a sum of the prices of 12 industrial stocks divided by 12. This rudimentary price-weighted average included companies like American Cotton Oil, General Electric, Laclede Gas, National Lead, and U.S. Leather. These were the behemoths of their time, representing the manufacturing and resource extraction industries that powered the burgeoning American economy. The simplicity of its calculation was a strength, making it easily understandable to a public grappling with the new realities of corporate finance. While today’s DJIA consists of 30 companies and employs a sophisticated divisor to account for stock splits and other corporate actions, its foundational principle—to track the performance of leading U.S. companies—remains unchanged, a testament to Charles Dow’s enduring insight.
Navigating Early Economic Turmoil
From its very inception, the Dow Jones Industrial Average served as a stark reflection of the nation’s economic fortunes. The late 19th and early 20th centuries were periods of immense change, characterized by rapid industrial expansion, but also punctuated by financial panics and global conflicts. The Dow meticulously recorded these swings, showing the optimism of growth spurts and the fear of downturns. Events like the Panic of 1907, a severe financial crisis triggered by a lack of liquidity, saw the nascent index plunge, demonstrating its immediate utility as a gauge of market anxiety. Similarly, the outbreak and progression of World War I, with its monumental impact on industrial production and global trade, were faithfully mirrored in the Dow’s fluctuations, highlighting its role as an economic barometer even in its earliest decades.
The Roaring Twenties, the Great Depression, and WWII: A Test of Resilience
The first half of the 20th century presented an extraordinary roller coaster of economic extremes, from unprecedented prosperity to devastating collapse, followed by the immense demands of global war. Through it all, the Dow Jones Industrial Average stood as an unblinking chronicler of these monumental shifts, its movements etched into the annals of financial history.
The Bull Market of the 1920s and Speculative Frenzy
Following the end of World War I, the United States entered an era of booming prosperity known as the “Roaring Twenties.” This decade saw widespread economic growth, technological innovation (automobiles, radio), and a significant increase in consumer spending. For the stock market, it was a period of unprecedented bullishness. The Dow soared to new heights, captivating the public imagination and drawing in legions of new investors. Speculation became rampant, fueled by easy credit and the belief that stock prices could only go up. The Dow’s consistent upward trajectory became synonymous with the era’s optimism, masking the underlying frothiness of the market and the unsustainable practices that were quietly accumulating beneath the surface.
Black Tuesday and the Market Crash of 1929
The speculative bubble of the 1920s burst dramatically with the stock market crash of October 1929. “Black Tuesday,” October 29, 1929, saw the Dow plummet by nearly 12%, a historic one-day decline. This catastrophic event marked the beginning of the Great Depression, the longest and most severe economic downturn in modern history. The Dow continued its descent for several years, ultimately losing nearly 90% of its value from its 1929 peak by July 1932. This period solidified the Dow’s reputation as the ultimate indicator of market health, albeit in the most painful way imaginable. The index’s dramatic collapse not only reflected the economic crisis but also became a symbol of the profound financial despair that gripped the nation.
The Long Road to Recovery and Wartime Mobilization
The 1930s were characterized by widespread unemployment, business failures, and government efforts to stimulate the economy, notably Franklin D. Roosevelt’s New Deal programs. The Dow’s recovery was agonizingly slow and volatile, interspersed with periods of false hope and renewed despair. However, the onset of World War II in 1939 and America’s eventual entry into the conflict in 1941 provided an unexpected, albeit tragic, catalyst for economic revival. The immense demand for wartime production—ships, planes, tanks, and ammunition—mobilized American industry on an unprecedented scale. Factories roared back to life, unemployment plummeted, and corporate profits surged. The Dow, reflecting this industrial resurgence, began a sustained climb, slowly but surely reclaiming lost ground and signaling the nation’s economic capacity to overcome adversity.

Post-War Prosperity, Technological Revolutions, and Global Integration
The latter half of the 20th century and the early decades of the 21st have seen the Dow Jones Industrial Average navigate an entirely new set of economic forces: sustained post-war growth, the rapid rise of technology, and an increasingly interconnected global economy. Its journey through these periods underscores its adaptive nature and its continued role as a mirror to America’s economic evolution.
The Mid-Century Boom and Diversification
Following World War II, the United States entered a prolonged period of economic prosperity. The GI Bill fueled a housing boom, consumer culture flourished, and American corporations expanded globally. The Dow reflected this robust growth, steadily climbing through the 1950s and 1960s. During this era, the composition of the Dow began to subtly shift, incorporating companies that represented the changing face of American industry—less heavy manufacturing and more consumer goods, services, and emerging technologies. This gradual diversification was critical, ensuring the index remained relevant as the U.S. economy matured and broadened its scope beyond its traditional industrial roots. The “blue-chip” nature of its constituents became more pronounced, representing stable, well-established companies with a track record of growth and profitability.
The Dot-Com Bubble and the New Economy
The late 20th century brought about the digital revolution, characterized by the explosion of the internet and the rise of technology companies. The “dot-com bubble” of the late 1990s saw unprecedented speculation in technology stocks, pushing valuations to unsustainable levels. While the NASDAQ Composite Index, heavily weighted towards tech, surged dramatically, the Dow, with its traditional industrial and mature technology constituents, experienced a more moderate, though still significant, climb. Its slower ascent and subsequent resilience during the dot-com bust highlighted its role as a more conservative, yet powerful, indicator of established economic strength. The Dow’s composition began to integrate more diverse tech giants, reflecting the enduring impact of information technology on every sector of the economy, but always with an eye towards established players.
Financial Crises of the 21st Century
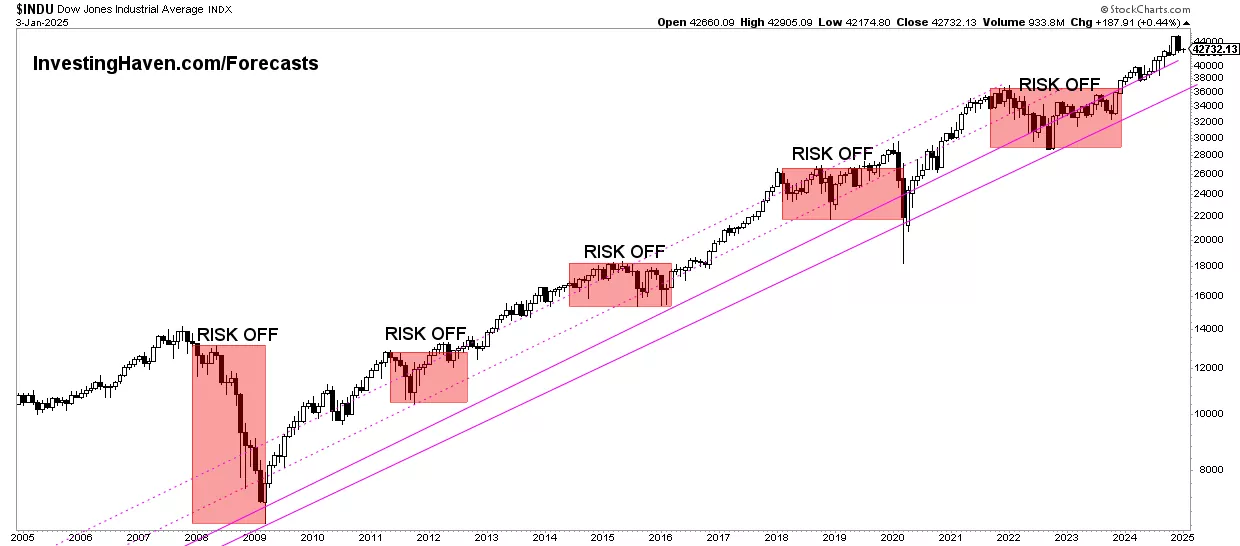
The 21st century has tested the Dow’s resilience with a series of significant financial challenges. The bursting of the housing bubble and the subsequent 2008 global financial crisis led to one of the most dramatic downturns in the Dow’s history since the Great Depression. The index plummeted, reflecting a profound crisis of confidence in the financial system. Yet, it demonstrated its remarkable capacity for recovery, steadily climbing back over the following years, driven by monetary policy, government intervention, and the inherent strength of American corporations. More recently, the COVID-19 pandemic in early 2020 triggered another sharp, albeit brief, decline, only for the Dow to rebound with astonishing speed, fueled by unprecedented stimulus and vaccine optimism. These events underscore the Dow’s continued role as a real-time gauge of investor sentiment and economic shock, as well as the underlying adaptive capabilities of the market it represents.
Understanding the Dow Today: Methodology and Modern Relevance
In its more than 125 years of existence, the Dow Jones Industrial Average has evolved considerably, adapting its methodology and constituents to remain a relevant and influential market barometer. While it continues to be one of the most watched indices, understanding its unique calculation and its place among other market indicators is crucial for any informed investor.
Price-Weighted Average: A Unique Calculation
Unlike most modern stock market indices, such as the S&P 500 or the NASDAQ Composite, which are market-capitalization weighted (meaning companies with larger market values have a greater impact on the index), the Dow Jones Industrial Average is price-weighted. This means that stocks with higher share prices have a greater influence on the index’s value than those with lower share prices, regardless of their total market capitalization. This historical calculation method, a relic of Charles Dow’s original simple average, makes it unique. To ensure continuity and prevent corporate actions like stock splits from distorting the index, a “Dow Divisor” is used. This divisor is adjusted whenever a stock splits, a company is replaced, or a dividend is paid in stock, effectively maintaining the historical continuity of the index’s movements despite changes in individual stock prices.
The “Blue-Chip” Standard and Index Evolution
The 30 companies that comprise the DJIA are carefully selected by the editors of The Wall Street Journal and represent large, well-established, and financially sound companies—often referred to as “blue-chip” stocks. These companies are leaders in their respective industries and are generally considered bellwethers of the U.S. economy. While the name “Industrial Average” is a historical artifact, today’s Dow is highly diversified, including companies from sectors such as technology (e.g., Apple, Microsoft), finance (e.g., JPMorgan Chase, Goldman Sachs), healthcare (e.g., Johnson & Johnson, UnitedHealth Group), retail (e.g., Walmart, Home Depot), and consumer goods (e.g., Coca-Cola, Procter & Gamble). The composition is not static; S&P Dow Jones Indices, which maintains the index, periodically makes changes to ensure it accurately reflects the changing landscape of the American economy and continues to represent leading companies.
Dow’s Role as an Economic Barometer vs. Broader Market Indicators
Despite its limitations (only 30 stocks, price-weighted), the Dow retains immense symbolic and practical importance. It serves as an easily digestible snapshot of how a select group of America’s largest and most influential companies are performing, often influencing investor sentiment and media narratives. Its movements are frequently cited in news reports and daily financial discussions, making it a powerful psychological gauge of market confidence. However, for a more comprehensive understanding of the broader market, investors typically look to market-capitalization-weighted indices like the S&P 500, which includes 500 large U.S. companies and better represents the overall market’s performance, or the Russell 2000 for small-cap performance. While the Dow may not be the most analytically robust index for portfolio construction, its historical lineage, enduring recognition, and its representation of core American business make it an indispensable, albeit specific, barometer of economic health.
Conclusion
The journey of the Dow Jones Industrial Average from a simple 12-stock average to a globally recognized financial icon is a testament to its enduring utility and adaptability. Born out of a simple yet profound need to measure market trends, the Dow has weathered economic booms and busts, technological revolutions, and global conflicts, always standing as a vigilant chronicler of America’s financial pulse. It has served as a symbol of prosperity in the Roaring Twenties, a stark indicator of despair during the Great Depression, and a beacon of recovery through periods of war and innovation.
Today, while the financial landscape is far more complex and diverse, the Dow Jones Industrial Average maintains its unique position. Its price-weighted methodology and selection of blue-chip companies give it a distinct flavor, offering a specific, powerful lens through which to view the performance of America’s industrial and corporate giants. For investors, financial professionals, and the public alike, understanding “how did the Dow Jones” come to be is to understand a significant chapter in economic history and to appreciate the ongoing evolution of financial markets. While it’s always wise to consider a wider array of indicators for a complete picture, the Dow continues to be an indispensable, highly visible, and historically rich barometer of the health and direction of the U.S. economy, forever etched into the fabric of global finance.
aViewFromTheCave is a participant in the Amazon Services LLC Associates Program, an affiliate advertising program designed to provide a means for sites to earn advertising fees by advertising and linking to Amazon.com. Amazon, the Amazon logo, AmazonSupply, and the AmazonSupply logo are trademarks of Amazon.com, Inc. or its affiliates. As an Amazon Associate we earn affiliate commissions from qualifying purchases.