
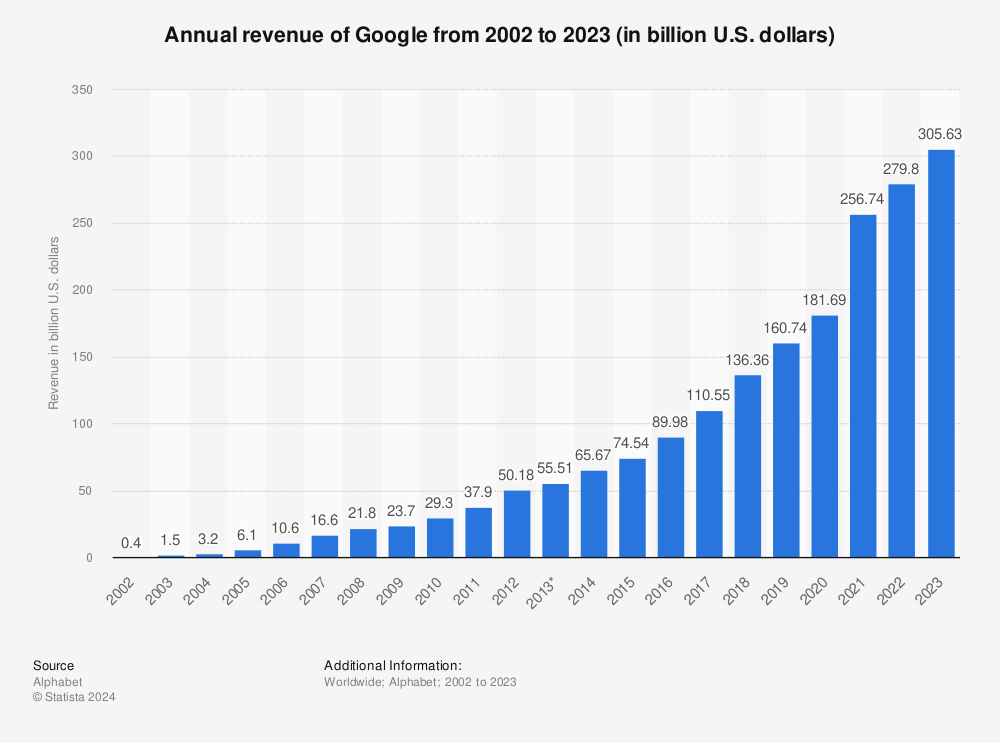
In the landscape of global finance, few entities command as much influence or generate as much capital as Alphabet Inc., the parent company of Google. To understand how much money Google makes a year is to peer into the mechanics of the modern digital economy. As of the most recent fiscal cycles, Alphabet has consistently reported annual revenues exceeding $300 billion, a figure that rivals the Gross Domestic Product (GDP) of entire nations. However, the raw numbers tell only part of the story. To truly grasp the financial magnitude of this enterprise, one must dissect where that money comes from, how it is managed, and the costs required to sustain such a massive economic engine.
Google’s financial performance is often viewed as a bellwether for the global advertising market and the health of the technology sector at large. With a market capitalization that frequently fluctuates between $1.5 trillion and $2 trillion, the company’s ability to generate cash is nearly unparalleled in the history of corporate finance.
The Revenue Engine: Breaking Down the Annual Billions
The primary driver behind Google’s financial success remains its core advertising business. In the most recent full fiscal year, Alphabet’s total revenue reached approximately $307.4 billion, a significant increase from previous years despite global economic headwinds. This growth trajectory highlights the company’s resilience and its entrenched position in the daily lives of billions of users.
Google Search and Advertising
The “Google Search & Other” segment remains the crown jewel of the company’s balance sheet. Generating over $175 billion annually, this single segment accounts for the vast majority of the company’s total income. The financial brilliance of Google Search lies in its intent-based advertising model. Unlike traditional media, where ads are pushed to a general audience, Google’s platform allows businesses to bid on specific keywords, ensuring that marketing spend is directed toward users who are actively seeking information or products. This high conversion rate allows Google to maintain premium pricing on its cost-per-click (CPC) models.
YouTube Ads and Subscriptions
YouTube has evolved from a video-sharing site into a financial titan in its own right. Annually, YouTube generates roughly $31.5 billion in advertising revenue. Beyond advertising, the platform has successfully pivoted toward a recurring revenue model through YouTube Premium and YouTube TV. These subscription services provide a stabilized cash flow that balances the volatility of the ad market, contributing billions more to the “Google Services” bottom line.
Google Network
The Google Network—comprising AdMob, AdSense, and Google Ad Manager—allows Google to place ads on third-party websites and apps. While this segment has seen slower growth compared to Search and YouTube, it still contributes over $30 billion annually. It serves as a critical infrastructure piece that allows Google to monetize the broader internet, not just its own proprietary platforms.
Beyond Advertising: The Rise of Google Cloud and Other Bets
For years, critics argued that Google was a “one-trick pony” dependent entirely on ad revenue. However, recent financial reports demonstrate a significant shift in the company’s income diversification. The most notable development has been the maturation of Google Cloud into a profitable and high-growth segment.
The Profitability of Google Cloud
Google Cloud, which includes Google Cloud Platform (GCP) and Google Workspace, has become a massive revenue generator, now surpassing $33 billion in annual sales. More importantly, after years of operating at a loss to gain market share against Amazon Web Services (AWS) and Microsoft Azure, Google Cloud turned a profit on an operating basis in 2023. This pivot from a “cash burn” phase to a “cash cow” phase is a milestone for Alphabet’s long-term financial health, providing a second major pillar of institutional revenue.
Other Bets: Investing for the Long Term
Alphabet’s “Other Bets” category includes moonshot projects like Waymo (autonomous driving), Verily (life sciences), and GV (venture capital). From a strictly financial perspective, this segment currently operates at an annual loss, often exceeding $3 billion to $4 billion. However, investors view these expenditures not as losses, but as Research and Development (R&D) investments that could lead to the next multibillion-dollar industry. These ventures are funded by the massive free cash flow generated by Search, allowing the company to experiment with future technologies without jeopardizing its current stability.
The Cost of Success: Expenses, TAC, and Infrastructure

While $300 billion in revenue is staggering, the costs associated with generating that money are equally massive. Alphabet’s net income—the actual profit left after all expenses are paid—typically hovers around $73 billion to $80 billion annually. Understanding where the other $220 billion goes is essential for any financial analysis of the company.
Traffic Acquisition Costs (TAC)
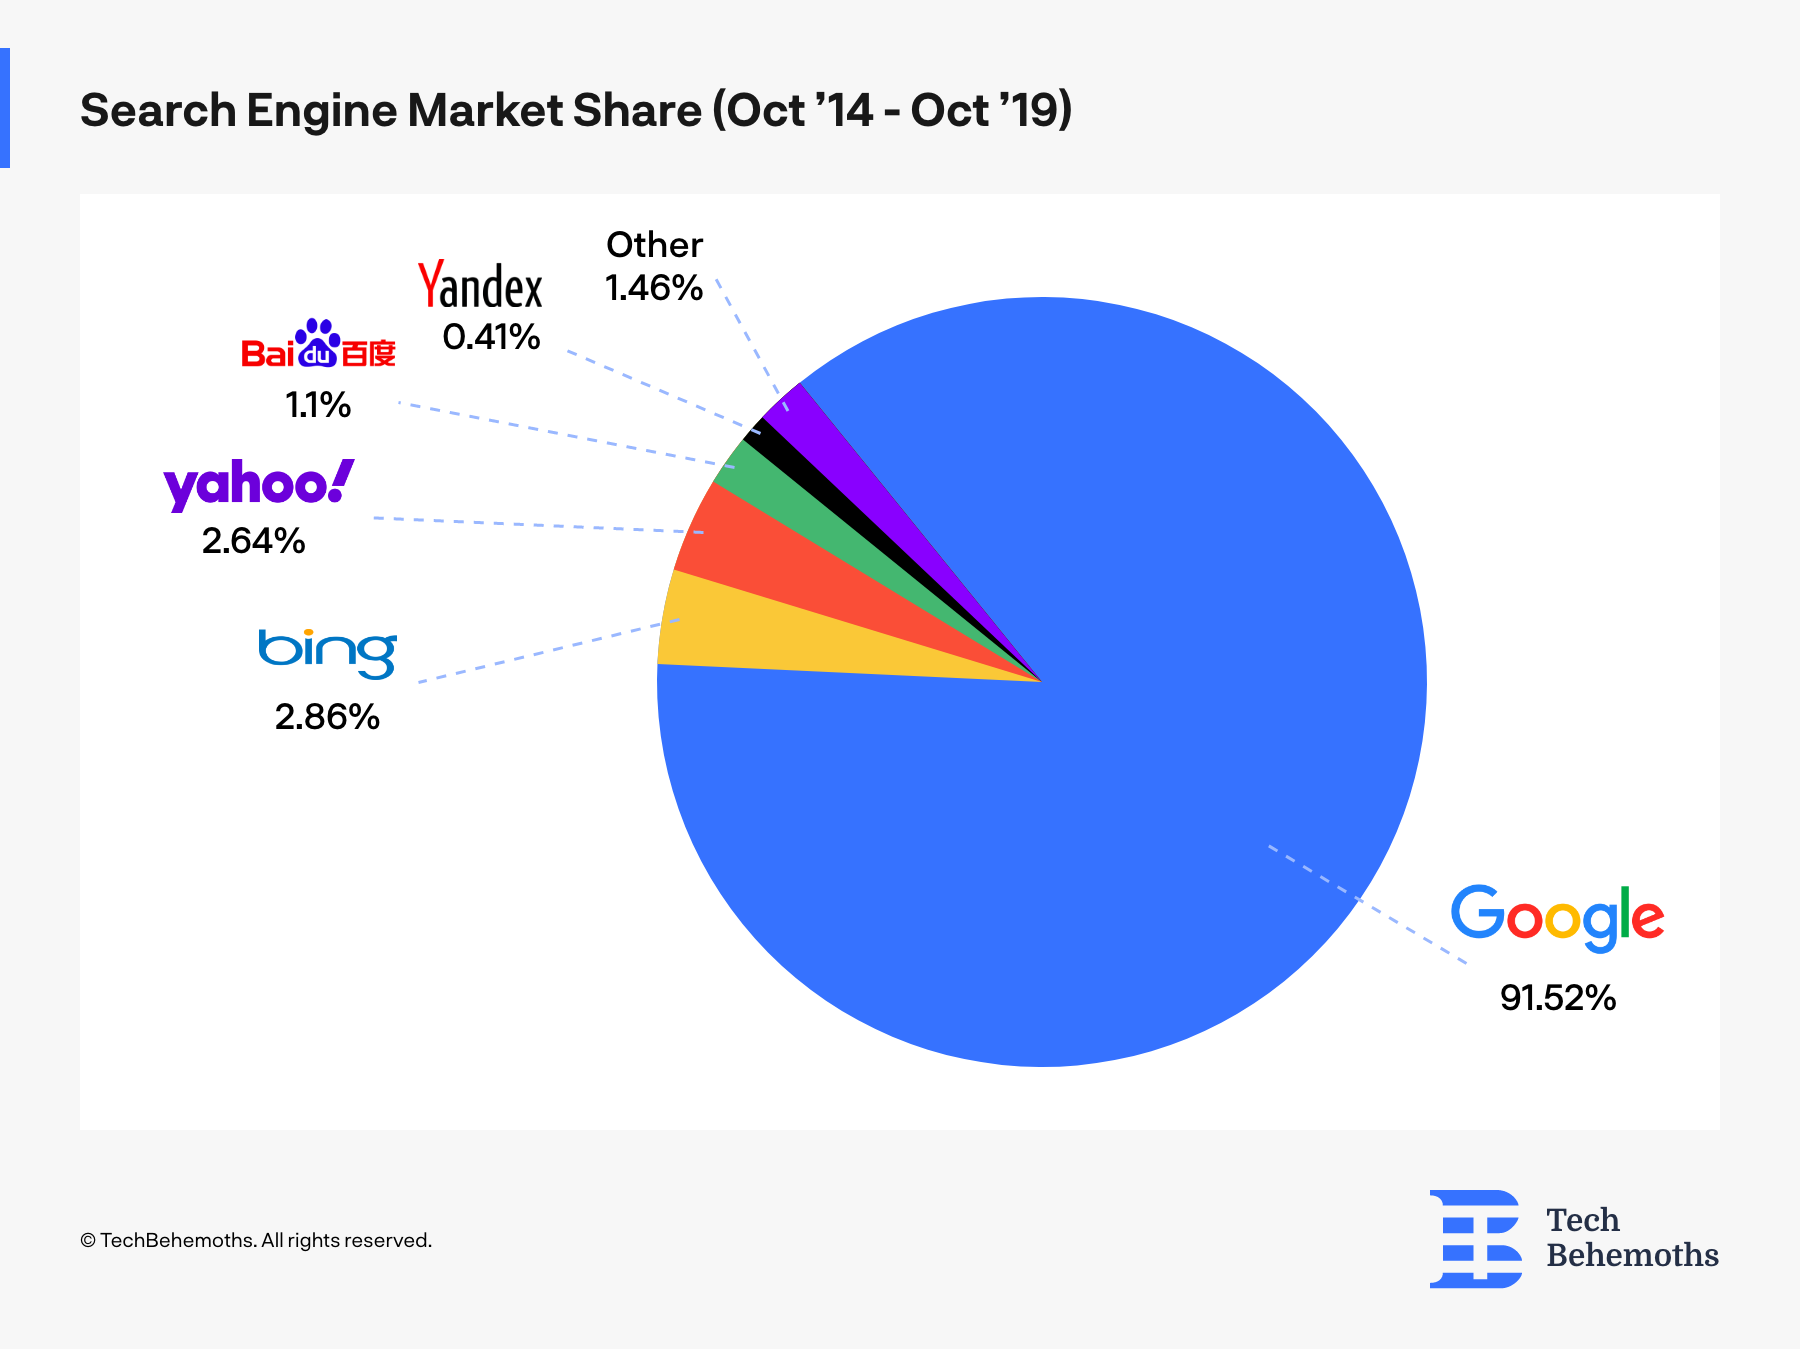
One of the most significant line items on Google’s balance sheet is Traffic Acquisition Costs. This represents the money Google pays to partners to be the default search engine on browsers and devices. For example, Google pays billions of dollars annually to Apple to remain the default search engine on the iPhone. TAC currently accounts for over $50 billion in annual expenditure. While this is a high price to pay, it is considered a necessary defensive expense to maintain Google’s dominant market share in the search ecosystem.
Research, Development, and Capital Expenditures
Innovation in the tech sector is prohibitively expensive. Alphabet spends roughly $45 billion a year on R&D, employing some of the world’s highest-paid engineers and data scientists. Furthermore, the company’s Capital Expenditure (CapEx) has surged recently, driven by the need to build and maintain massive data centers required for Artificial Intelligence (AI) and Cloud computing. These physical assets—servers, cooling systems, and fiber optic networks—require an annual investment of over $30 billion.
Legal and Regulatory Contingencies
In recent years, Google has had to earmark billions for legal fees and regulatory fines, particularly in the European Union and the United States. While these are often one-time hits to the quarterly earnings, they represent a significant recurring financial risk that the company must manage through high liquidity and cash reserves.
Investor Perspectives: Margins and Shareholder Value
From a business finance perspective, Google (Alphabet) is a marvel of efficiency. Despite its size, the company maintains operating margins in the range of 27% to 30%. This means that for every dollar Google brings in, it keeps nearly 30 cents as operating profit—a remarkably high figure for a company with such extensive physical and human infrastructure.
Share Buybacks and Dividends
Because Google generates more cash than it can effectively reinvest in its own operations, it has become a leader in returning value to shareholders. In recent years, Alphabet has authorized share buyback programs exceeding $70 billion. By reducing the number of shares outstanding, the company increases the value of each remaining share, effectively boosting the stock price and benefiting institutional and individual investors. In 2024, the company also initiated its first-ever dividend, signaling a new era of financial maturity where it rewards long-term holders with direct cash payments.
Earnings Per Share (EPS) and P/E Ratios
Investors closely monitor Google’s Earnings Per Share (EPS), which has shown consistent growth. At a price-to-earnings (P/E) ratio typically ranging between 20 and 25, Google is often priced more conservatively than other high-growth tech stocks like Nvidia or Tesla. This suggests that the market views Google as a stable, reliable “utility” of the internet, capable of generating massive profits regardless of the broader economic cycle.
Future Outlook: The Financial Impact of Generative AI
The question of how much money Google makes in the future will be answered by its success in the AI race. The integration of Generative AI into Search—a project known as the Search Generative Experience (SGE)—represents both a financial risk and a massive opportunity.
The Higher Cost of AI Queries
A traditional Google search is computationally “cheap” to process. An AI-generated response, however, requires significantly more processing power from specialized chips (like GPUs and TPUs). This increases the “cost per query,” which could potentially squeeze profit margins if Google cannot find ways to monetize these AI interactions more effectively than traditional links.
New Revenue Frontiers
Conversely, AI offers Google the chance to capture more of the enterprise market through Google Cloud. By offering proprietary AI models (like Gemini) to other businesses, Google can create new subscription-based revenue streams that do not depend on the advertising market. This pivot toward “AI-as-a-Service” could be the key to Alphabet reaching the $400 billion or $500 billion annual revenue milestone within the next decade.
In conclusion, Google’s annual earnings are a testament to the power of digital platforms and data-driven advertising. While the company faces increasing competition and regulatory scrutiny, its diversified revenue streams—spanning from Search and YouTube to Cloud and AI—ensure that it remains one of the most profitable and financially stable entities in the world. For the foreseeable future, Google will continue to be a dominant force in global finance, turning the world’s information into a multi-hundred-billion-dollar annual windfall.
aViewFromTheCave is a participant in the Amazon Services LLC Associates Program, an affiliate advertising program designed to provide a means for sites to earn advertising fees by advertising and linking to Amazon.com. Amazon, the Amazon logo, AmazonSupply, and the AmazonSupply logo are trademarks of Amazon.com, Inc. or its affiliates. As an Amazon Associate we earn affiliate commissions from qualifying purchases.