
Understanding the rate of inflation is fundamental to sound financial planning, investment strategy, and business operations. It directly impacts purchasing power, the real value of assets, and the cost of living. One of the most widely recognized and utilized metrics for gauging inflation is the Consumer Price Index (CPI). By tracking changes in the CPI over time, individuals and organizations can accurately calculate the rate at which prices for goods and services are rising, offering critical insights into economic trends and their financial implications.
Understanding Inflation and Its Impact
Inflation represents the rate at which the general level of prices for goods and services is rising, and subsequently, the purchasing power of currency is falling. A dollar today buys less than it did yesterday, or will buy less than it will tomorrow. This economic phenomenon is a constant consideration for anyone managing money, from household budgets to multinational corporate finance.
What is Inflation?
At its core, inflation is an increase in the aggregate price level of an economy. It’s not about the price of a single item going up, but rather a sustained increase across a broad spectrum of goods and services. When inflation is high, the cost of living increases significantly, eroding the value of savings and reducing the real returns on investments. Conversely, very low or negative inflation (deflation) can also be problematic, signaling weak demand and potentially leading to economic stagnation. For individuals, understanding inflation is crucial for planning retirement, saving for large purchases, and ensuring their income growth keeps pace with rising costs. For businesses, inflation affects production costs, pricing strategies, and profit margins.
Why CPI Matters
The Consumer Price Index (CPI) is a statistical estimate constructed using the prices of a sample of representative items whose prices are collected periodically. It serves as a benchmark for measuring price changes and, consequently, inflation from the perspective of the typical consumer. Governments, central banks, and economists closely monitor the CPI as a primary indicator of economic health and inflationary pressures. For financial markets, the CPI release is a major event, often influencing interest rate decisions, bond yields, and stock market sentiment. For the average person, changes in the CPI are a direct reflection of how much more (or less) they need to spend to maintain their standard of living. This makes the CPI an indispensable tool for wage negotiations, adjusting pension benefits, and indexing various financial contracts.
Deconstructing the Consumer Price Index (CPI)
The CPI is far more than just a simple average of prices; it’s a meticulously constructed index designed to represent the typical spending habits of a particular population segment. Its accuracy and relevance stem from the careful selection and weighting of items within its “basket” of goods and services.
Components of the CPI Basket
The “basket” of goods and services used to calculate the CPI is a comprehensive collection of categories representing a wide range of consumer expenditures. These typically include:
-
Food and Beverages: Groceries, restaurant meals, snacks.
-
Housing: Rent for primary residence, owner’s equivalent rent, utilities (electricity, gas, water), household furnishings. This category often carries the largest weight due to its significant share of typical household budgets.
-
Apparel: Clothing and footwear.
-
Transportation: New and used vehicles, motor fuel, public transportation fares, vehicle insurance.
-
Medical Care: Prescription drugs, medical services, hospital services.
-
Recreation: Entertainment, hobbies, sporting goods, pets.
-
Education and Communication: Tuition fees, school books, telephone services, internet services.
-
Other Goods and Services: Personal care products, tobacco, miscellaneous services.
Each of these categories, and the specific items within them, are assigned a weight based on their relative importance in the average consumer’s spending. For example, housing costs typically constitute a much larger portion of a household budget than, say, tobacco, and are thus given a higher weighting in the CPI calculation. This weighting ensures that the index accurately reflects the impact of price changes on overall consumer spending and financial well-being. These weights are periodically updated to reflect evolving consumer purchasing patterns, ensuring the CPI remains relevant.
How CPI Data is Collected
The process of collecting CPI data is extensive and systematic. In the United States, the Bureau of Labor Statistics (BLS) is responsible for this task. Price data for the roughly 80,000 items in the CPI basket are collected monthly (or sometimes bimonthly) from a sample of thousands of retail stores, service establishments, and rental units across 75 urban areas. This is achieved through various methods, including personal visits by data collectors, telephone calls, and increasingly, online data collection. For rental units, data is collected directly from tenants and landlords. The goal is to capture actual transaction prices, including sales taxes and excise duties. The sheer volume and geographical diversity of the data collection ensure that the CPI is representative of a significant portion of the population – typically urban consumers, which represent about 93% of the total U.S. population. The BLS then aggregates and processes this data to produce various CPI indices, often broken down by region, specific goods/services, or demographic groups.
Step-by-Step Calculation of Inflation Rate Using CPI
Calculating the inflation rate using CPI data is a straightforward process once you have the necessary figures. It involves comparing the CPI from two different periods to determine the percentage change.
The Basic Formula
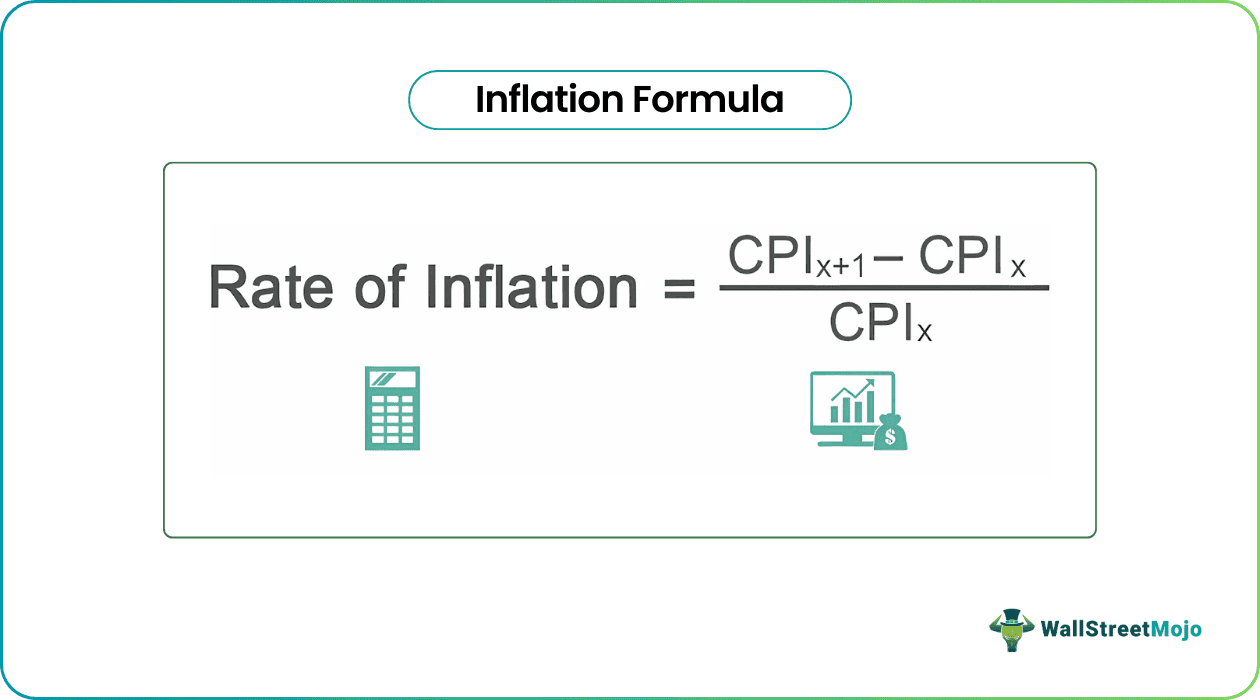
The most common method for calculating the inflation rate between two periods using the CPI is as follows:
Inflation Rate (%) = [ (CPIcurrent year – CPIprevious year) / CPI_previous year ] * 100
Where:
-
CPI_current year refers to the Consumer Price Index for the more recent period.
-
CPI_previous year refers to the Consumer Price Index for an earlier period (often the same month in the prior year, or the average for the prior year).
This formula yields the percentage change in the price level over the specified timeframe.
Sourcing CPI Data
To perform this calculation, you first need reliable CPI data. Official government statistical agencies are the primary and most accurate sources. For example:
-
United States: The Bureau of Labor Statistics (BLS) publishes detailed CPI data on its website (www.bls.gov). You can find CPI for all urban consumers (CPI-U), specific cities, product categories, and more.
-
European Union: Eurostat (ec.europa.eu/eurostat) provides the Harmonised Index of Consumer Prices (HICP) for Eurozone countries.
-
United Kingdom: The Office for National Statistics (ONS) publishes CPI data for the UK (www.ons.gov.uk).
-
Canada: Statistics Canada (www.statcan.gc.ca) provides CPI data for Canada.
When sourcing data, it’s crucial to ensure you are using consistent series. For instance, if you’re calculating year-over-year inflation, use the CPI from January of the current year and compare it to the CPI from January of the previous year. Similarly, ensure you are comparing like-for-like indices, such as CPI for All Urban Consumers (CPI-U) if you’re looking at general inflation trends for a country.
Practical Example Calculation
Let’s illustrate with a hypothetical example using CPI data:

Suppose the CPI for a particular country was:
-
January 2023 (CPI_previous year) = 296.800
-
January 2024 (CPI_current year) = 308.500
Now, apply the formula:
Inflation Rate (%) = [ (308.500 – 296.800) / 296.800 ] * 100
Inflation Rate (%) = [ 11.700 / 296.800 ] * 100
Inflation Rate (%) = 0.03942 * 100
Inflation Rate (%) = 3.94%
This calculation indicates that, from January 2023 to January 2024, the general price level for consumer goods and services, as measured by the CPI, increased by approximately 3.94%. This means that what cost $100 in January 2023 would, on average, cost about $103.94 in January 2024. For personal finance, this percentage directly translates to the erosion of purchasing power; your money buys about 3.94% less than it did a year ago. For businesses, this might indicate how much more they need to spend on supplies or how much they might need to adjust their pricing.
Nuances and Limitations of CPI-Based Inflation
While the CPI is an invaluable tool, it’s not without its complexities and limitations. Understanding these nuances provides a more complete and realistic picture of inflation.
Substitution Bias
One significant limitation is the substitution bias. The CPI basket is fixed for a period, assuming consumers buy the same amount of each good regardless of price changes. However, in reality, when the price of a good rises significantly, consumers often substitute it with a cheaper alternative. For example, if the price of beef skyrockets, consumers might buy more chicken or pork. The fixed-basket CPI would then overstate the actual cost of living increase because it doesn’t account for this rational consumer behavior. While agencies periodically update the basket, real-time substitution is not immediately reflected.
Quality Bias
The quality bias refers to the challenge of accounting for improvements in the quality of goods and services over time. A new smartphone might cost more than its predecessor, but it also offers significantly enhanced features and capabilities. If the CPI simply registers the higher price without adjusting for the improved quality, it might overstate inflation. Similarly, medical procedures become more effective, and vehicles become safer and more fuel-efficient. Disentangling a pure price increase from a price increase due to better quality is inherently difficult and can lead to an upward bias in measured inflation.
New Goods Bias
The introduction of entirely new goods poses another challenge. When a new product comes to market, its price often falls rapidly in its early adoption phase (e.g., flat-screen TVs or personal computers decades ago). The CPI typically takes time to incorporate new goods into its basket, meaning it misses these initial price declines, potentially overstating the true cost of living and underestimating the benefits of innovation.
Housing Costs and Owner-Equivalent Rent
Measuring housing costs accurately for homeowners is particularly complex. For renters, it’s straightforward (rent payments). However, for homeowners, the CPI uses a concept called owner-equivalent rent (OER). Instead of tracking house prices (which are an investment, not a consumption cost), the OER estimates how much a homeowner would pay to rent a home similar to their own. This attempt to capture the “service” of housing can sometimes diverge from actual housing market trends, particularly during periods of rapid house price appreciation or depreciation, leading to debates about its accuracy in reflecting true housing costs.
Core Inflation vs. Headline Inflation
To get a clearer picture of underlying inflationary trends, economists often distinguish between headline inflation and core inflation. Headline inflation is the total inflation figure, including all items in the CPI basket. Core inflation, however, excludes volatile items like food and energy prices. Food and energy prices can fluctuate wildly due to seasonal factors, weather events, geopolitical tensions, or supply chain disruptions, which might not reflect long-term inflationary pressures. By removing these volatile components, core inflation provides a smoother, more stable measure that central banks often rely on when making monetary policy decisions.
Applying Inflation Knowledge to Personal and Business Finance
Understanding how to calculate and interpret inflation using the CPI is not merely an academic exercise; it has profound practical implications for financial decision-making at both individual and corporate levels.
Financial Planning and Budgeting
For personal finance, inflation is a silent thief of purchasing power. A 3% annual inflation rate means that if your income doesn’t increase by at least 3%, your real income has effectively decreased. This knowledge is crucial for:
-
Budgeting: Adjusting your monthly budget to account for rising costs of groceries, utilities, and transportation.
-
Savings Goals: Ensuring your savings rate is high enough to offset inflation, especially for long-term goals like retirement. A $1 million retirement nest egg today will have significantly less purchasing power in 20 or 30 years due to inflation.
-
Retirement Planning: Factoring in future inflation rates when projecting retirement expenses and income needs. Pensions and social security benefits are often indexed to inflation, but personal savings plans need proactive management.
Investment Decisions
Inflation plays a critical role in investment strategy. Investors must consider not just nominal returns (the stated return) but real returns (nominal return minus the inflation rate).
-
Inflation-Hedged Assets: Investing in assets that tend to perform well during inflationary periods, such as Treasury Inflation-Protected Securities (TIPS), real estate, commodities, or dividend-paying stocks from companies with strong pricing power.
-
Equity vs. Fixed Income: Historically, equities have offered better long-term protection against inflation than traditional fixed-income investments, whose real returns can be severely eroded by rising prices.
-
Diversification: Building a diversified portfolio that can withstand various economic conditions, including inflationary pressures.
Wage Negotiations and Salary Reviews
Employees armed with an understanding of CPI-based inflation can more effectively negotiate for salary increases. If the CPI shows a 4% year-over-year increase, an employee might reasonably argue for a raise of at least 4% simply to maintain their current purchasing power. Businesses, too, must consider inflation when setting salary budgets to ensure competitive compensation and prevent a decline in employee morale due to shrinking real wages.

Business Strategy and Pricing
For businesses, inflation directly impacts the cost of doing business.
-
Cost of Goods Sold (COGS): Inflation drives up the cost of raw materials, labor, and transportation, directly affecting COGS and, consequently, profit margins.
-
Pricing Strategies: Companies need to carefully adjust their pricing to absorb rising costs without alienating customers or losing market share. This requires a delicate balance and a keen awareness of both internal cost pressures and competitor pricing.
-
Capital Expenditures: The cost of new equipment, technology, and infrastructure also increases with inflation, impacting long-term investment decisions and capital budgeting.
-
Inventory Management: Holding excessive inventory during inflationary periods can mean higher holding costs, but too little can lead to missed sales opportunities if replacement costs rise sharply.
In essence, the CPI and the inflation rate it helps calculate serve as a vital financial compass, guiding both personal and business decisions through the ever-changing economic landscape. By mastering its calculation and understanding its implications, one can navigate financial challenges more effectively and plan for a more secure economic future.
aViewFromTheCave is a participant in the Amazon Services LLC Associates Program, an affiliate advertising program designed to provide a means for sites to earn advertising fees by advertising and linking to Amazon.com. Amazon, the Amazon logo, AmazonSupply, and the AmazonSupply logo are trademarks of Amazon.com, Inc. or its affiliates. As an Amazon Associate we earn affiliate commissions from qualifying purchases.