
In the intricate world of technology, where abstract data meets tangible applications, the ability to visualize complex relationships is paramount. At the heart of this visualization lies a fundamental mathematical concept: the function graph. Far from being a relic of high school algebra, function graphs are the unsung heroes powering everything from sophisticated AI algorithms and robust software design to intuitive user interfaces and insightful data analytics. They provide a universal visual language, translating abstract rules and numerical data into patterns and trends that humans and machines alike can interpret. Understanding what a function graph is, how it’s constructed, and how modern technology leverages it, is not merely an academic exercise; it’s a critical skill for anyone navigating or building within the tech landscape. This article delves into the essence of function graphs, revealing their structure, their technological implementation, and their indispensable role in shaping our digital future.
The Core Concept: Bridging Abstract Functions and Visual Understanding
At its most fundamental, a function graph is a visual representation of a mathematical function. It’s the bridge that transforms an abstract rule or a set of ordered pairs into a geometric shape, making its behavior and characteristics immediately discernible.
Defining a Function: The Rule and Its Relationship
Before we can graph a function, we must understand what a function is. In mathematics, a function is a special type of relation where each input from a set (the domain) corresponds to exactly one output in another set (the codomain or range). Think of it as a precise machine: you put something in, and you always get one specific thing out. For instance, in the function y = 2x + 1, if you input x = 3, you always get y = 7. There’s no ambiguity. This deterministic relationship is what makes functions incredibly powerful for modeling predictable processes and systems – a core requirement in technology.
From Numbers to Points: The Cartesian Coordinate System
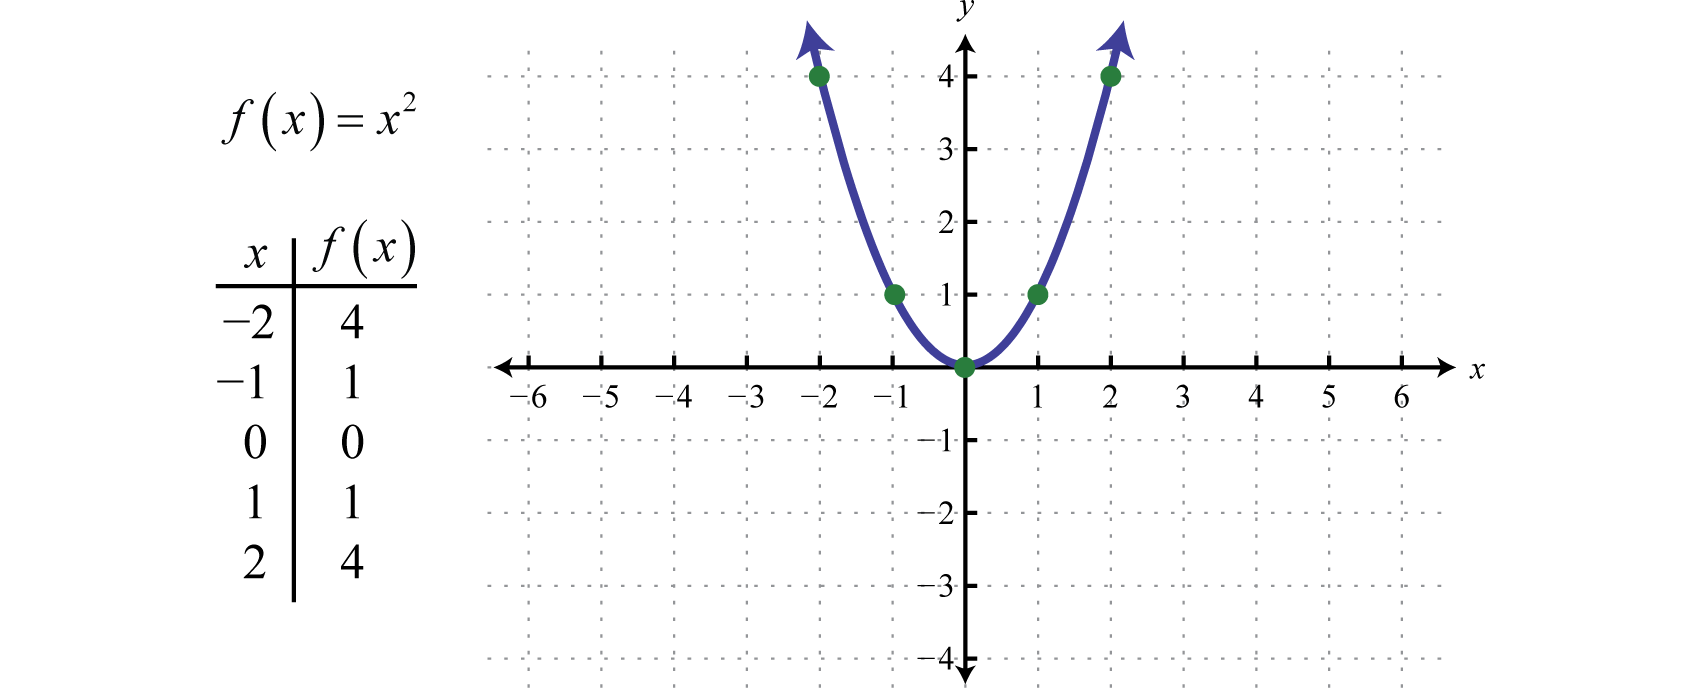
The visual magic of a function graph happens on the Cartesian coordinate system, named after the French mathematician René Descartes. This system consists of two perpendicular number lines: the horizontal x-axis (often representing the independent variable, or input) and the vertical y-axis (representing the dependent variable, or output). Every point on this plane can be uniquely identified by an ordered pair (x, y). When we graph a function, we plot every (input, output) pair as (x, y) coordinates. The collection of all such points forms the graph of the function. For example, for y = 2x + 1, the points (0, 1), (1, 3), (2, 5), (-1, -1) all lie on its graph, forming a straight line.
The Visual Story: Why We Graph Functions
Why bother graphing functions when we have their algebraic definitions? The answer lies in human cognition and the power of visual communication. A graph provides an immediate, intuitive understanding of a function’s behavior that might be obscured by its algebraic form. We can quickly discern:
-
Trends: Is the value increasing or decreasing?
-
Extrema: Where are the maximum or minimum values?
-
Intersections: Where does it cross the axes or another function?
-
Rate of Change: How steeply is the value changing?
-
Continuity: Are there any breaks or jumps in the function’s output?
These insights are crucial in tech for identifying patterns in data, optimizing algorithms, or predicting system performance.
The Anatomy of a Function Graph in a Digital Age
A function graph is more than just a line or curve; it’s a rich source of information, laden with features that tell a story about the underlying function. In the digital age, understanding these anatomical components is critical for interpreting the vast amounts of data visualized across tech platforms.
Key Elements: Axes, Intercepts, and Asymptotes
-
Axes: As mentioned, the x-axis (input) and y-axis (output) form the fundamental framework. Often, in tech applications, these axes are labeled with context-specific units (e.g., time, memory usage, cost, accuracy percentage).
-
Intercepts: These are the points where the graph crosses the axes. The y-intercept (where x=0) indicates the function’s starting value or initial condition. The x-intercepts (where y=0, also known as roots or zeros) represent input values that yield a zero output – often significant in problem-solving (e.g., points of equilibrium, conditions for success/failure).
-
Asymptotes: These are lines that the graph approaches but never quite touches as it extends infinitely. They indicate boundary conditions or impossible values. For example, a function modeling server load might have a vertical asymptote at a certain user count, indicating a system crash if that load is reached. Horizontal asymptotes might represent a limiting factor or a steady-state value in a long-term process.
Common Function Types and Their Graphs
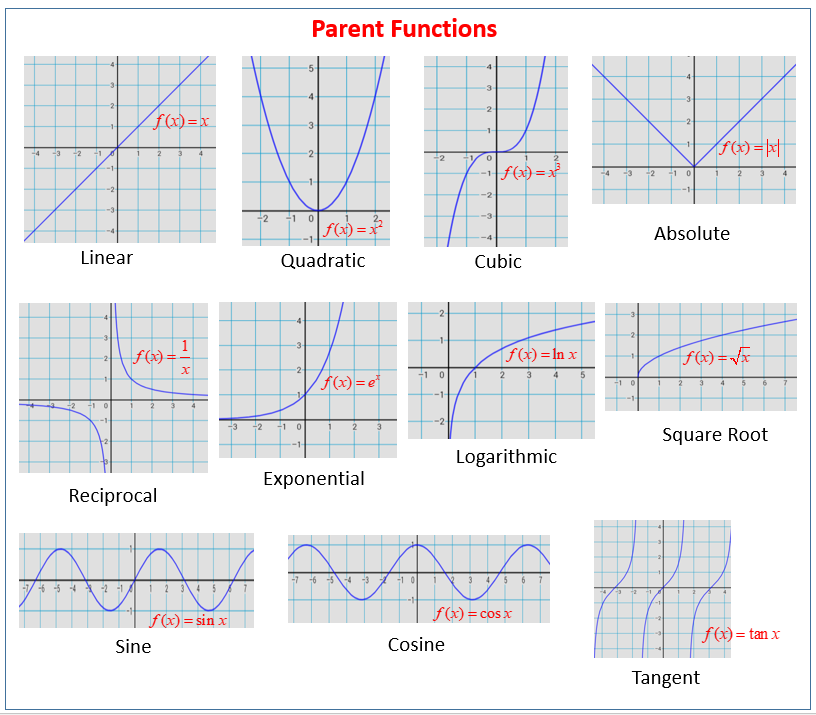
Different types of functions yield characteristic graph shapes, each with implications for how they model real-world phenomena in tech:
-
Linear Functions (
y = mx + b): Straight lines, indicating a constant rate of change. Used for modeling consistent growth, direct proportionality (e.g., cost per unit, simple sensor readings). -
Quadratic Functions (
y = ax^2 + bx + c): Parabolas, showing acceleration or deceleration, with a single maximum or minimum point. Essential in optimization problems, projectile motion simulations, or analyzing error distributions. -
Exponential Functions (
y = a * b^x): Curves that show rapid growth or decay. Crucial for modeling compound interest, population growth, spread of viruses, Moore’s Law, or radioactive decay (e.g., battery life). -
Logarithmic Functions (
y = log_b(x)): The inverse of exponential functions, showing a decreasing rate of growth. Used in data compression, scaling algorithms, and measuring sound intensity (decibels).
Understanding these basic forms allows tech professionals to quickly categorize and infer the behavior of the systems they are working with.
Interpreting Graph Features for Real-World Insights
Beyond just recognizing shapes, interpreting specific features of a graph provides actionable insights:
-
Slope/Gradient: The steepness of a line or curve indicates the rate of change. A positive slope means growth, a negative slope means decay. In software performance, a steep positive slope on a “time vs. operations” graph indicates poor scalability.
-
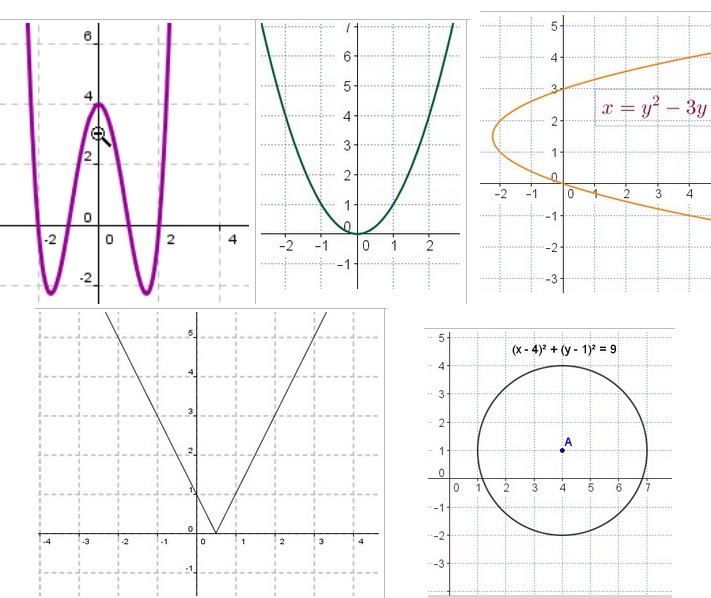
Concavity: Whether a curve bends upwards or downwards (concave up or concave down) indicates how the rate of change itself is changing. This is crucial in machine learning for understanding optimization landscapes.
-
Local Maxima and Minima: Peaks and troughs on a curve represent optimal or worst-case scenarios. Finding these points is key to resource allocation, performance tuning, and identifying turning points in data trends.
Technology’s Role in Graphing: From Calculators to AI
While the principles of function graphing are ancient, technology has profoundly transformed how we create, interact with, and derive insights from these visualizations. Modern tools make complex graphing accessible and dynamic.
Interactive Graphing Tools and Software
Gone are the days when graphing was a tedious, hand-drawn affair. Today, powerful software and web applications make interactive graphing effortless:
-
Desmos: A free online graphing calculator that allows users to plot equations, inequalities, and data, instantly visualizing changes as parameters are adjusted. Its user-friendliness makes it a popular tool for education and quick prototyping.
-
GeoGebra: Combines geometry, algebra, spreadsheets, graphing, statistics, and calculus into one easy-to-use package. Widely used in educational settings and by professionals for dynamic mathematical exploration.
-
Wolfram Alpha: More than just a calculator, this computational knowledge engine can interpret natural language queries to graph functions, compare them, and provide detailed mathematical analysis.
-
MATLAB/Octave: Industry-standard numerical computing environments that excel at plotting complex mathematical functions and scientific data, offering extensive customization and analysis capabilities.
These tools empower engineers, data scientists, and developers to explore function behavior rapidly, test hypotheses, and communicate results effectively.
Programming Libraries for Data Visualization
For programmers and data professionals, integrating graphing capabilities directly into their code is essential. Libraries in popular programming languages provide the backbone for advanced data visualization:
-
Matplotlib (Python): The foundational plotting library for Python, offering vast control over every aspect of a graph. It’s indispensable for scientific computing and data analysis, allowing users to create static, animated, and interactive visualizations.
-
Seaborn (Python): Built on Matplotlib, Seaborn simplifies the creation of attractive and informative statistical graphics. It’s particularly useful for exploring relationships within datasets and is a staple in machine learning and data science workflows.
-
D3.js (JavaScript): A powerful JavaScript library for producing dynamic, interactive data visualizations in web browsers. D3.js allows developers to bind arbitrary data to a Document Object Model (DOM) and apply data-driven transformations, making it ideal for creating custom, complex web-based graphs.
-
Plotly (Python/R/JavaScript): An open-source graphing library that allows for interactive, publication-quality graphs online and offline. Its support for 3D graphs and various interactive features makes it a favorite for exploratory data analysis and dashboards.
These libraries are critical for automating graph generation, handling large datasets, and integrating visualizations into applications and reports.
Function Graphs in AI and Machine Learning
The relationship between function graphs and AI is profound. Many core concepts in AI, especially machine learning, are inherently functional and best understood graphically:
-
Loss Functions: These functions quantify the error of a machine learning model. Graphing a loss function against model parameters helps visualize the “landscape” of potential solutions, where the goal is to find the lowest point (global minimum) through optimization algorithms like gradient descent.
-
Activation Functions: Used in artificial neural networks, activation functions determine the output of a neuron. Their graphs (e.g., ReLU, sigmoid, tanh) show their non-linear behavior, which is crucial for networks to learn complex patterns.
-
Decision Boundaries: In classification tasks, function graphs can represent the boundaries that a model learns to separate different classes of data points.
-
Performance Metrics: The performance of AI models is often evaluated and visualized using function graphs, such as learning curves (model performance vs. training iterations) or ROC curves (true positive rate vs. false positive rate).
Understanding these graphs is key to diagnosing model issues, interpreting results, and improving AI system performance.
Practical Applications: Where Function Graphs Power Innovation
The applications of function graphs extend across nearly every domain of technology, serving as essential tools for analysis, design, and prediction.
Software Development and Algorithm Design
-
Performance Analysis: Developers use graphs to visualize algorithm complexity (e.g., time or space complexity as a function of input size, like O(n), O(log n)). This helps in choosing the most efficient algorithm for a given task.
-
Resource Management: Graphs can plot resource consumption (CPU, memory, network bandwidth) against application load, helping identify bottlenecks and optimize system architecture.
-
Debugging: Visualizing data flow or variable changes over time can help debug complex software issues by revealing unexpected patterns.
Data Science and Analytics
-
Trend Analysis and Forecasting: Function graphs are fundamental for identifying trends in data (e.g., sales over time, website traffic, stock prices) and building predictive models.
-
Pattern Recognition: Graphs help data scientists spot anomalies, clusters, and correlations in large datasets that might be invisible in raw numbers.
-
Exploratory Data Analysis (EDA): Histograms, scatter plots, and line graphs (all forms of function graphs, implicitly or explicitly) are the first tools for understanding the distribution and relationships within new datasets.
-
Model Evaluation: Visualizing model predictions against actual values, plotting residuals, or displaying performance metrics like precision-recall curves are all critical for evaluating the effectiveness of data models.
Engineering and Simulation
-
System Behavior Modeling: Engineers use function graphs to model the behavior of physical systems (e.g., electrical circuits, mechanical vibrations, fluid dynamics) under different conditions.
-
Optimization Problems: In design and manufacturing, graphs help visualize objective functions and constraints, enabling engineers to find optimal solutions for efficiency, cost, or performance.
-
Control Systems: Feedback loops and control algorithms are often designed and analyzed using their functional graphs to ensure stability and desired response characteristics.
User Experience (UX) Design
-
User Flow Mapping: While not always explicit mathematical functions, the principles of flow and sequential steps in UX design can be visualized in graph-like structures, showing user journeys and decision points.
-
Interaction Curves: Graphs can model the perceived difficulty or satisfaction of a user interaction over time or across different scenarios, helping designers refine interfaces for better usability.
-
A/B Testing Visualization: Plotting metrics like conversion rates or engagement against different UI variations helps designers make data-driven decisions.
Mastering Function Graphs: A Crucial Skill for the Tech Professional
In a world increasingly driven by data and algorithmic complexity, the ability to read, interpret, and generate function graphs is no longer a niche skill for mathematicians but a fundamental competency for anyone in technology.
Beyond Memorization: Developing Intuition
True mastery of function graphs goes beyond memorizing formulas and shapes. It involves developing an intuition for how changes in a function’s parameters affect its visual representation, and conversely, how a graph’s visual characteristics translate back into functional properties. This intuition allows tech professionals to quickly understand new data, diagnose problems, and innovate solutions without getting bogged down in intricate calculations.
Continuous Learning and Exploration
The landscape of graphing tools and visualization techniques is constantly evolving. Staying updated with new programming libraries, interactive platforms, and best practices for data storytelling through graphs is essential. Continuous exploration of different function types and their real-world applications will only deepen one’s understanding and expand their problem-solving toolkit.
Conclusion
The function graph is a cornerstone of modern technology, a universal visual language that demystifies abstract relationships and illuminates complex data. From the foundational definitions of inputs and outputs to the advanced algorithms powering artificial intelligence, understanding how functions are visually represented is indispensable. By leveraging interactive tools and powerful programming libraries, tech professionals can transform raw data and abstract concepts into insightful, actionable visualizations. Mastering the art and science of function graphing is not just about plotting points; it’s about gaining a deeper understanding of the systems we build, the data we analyze, and the future we are collectively shaping. For anyone aspiring to innovate and lead in the tech world, a profound grasp of what a function graph is, and its manifold applications, is an absolute necessity.
aViewFromTheCave is a participant in the Amazon Services LLC Associates Program, an affiliate advertising program designed to provide a means for sites to earn advertising fees by advertising and linking to Amazon.com. Amazon, the Amazon logo, AmazonSupply, and the AmazonSupply logo are trademarks of Amazon.com, Inc. or its affiliates. As an Amazon Associate we earn affiliate commissions from qualifying purchases.