
In the intricate world of finance, where every decision can have a tangible impact on your wealth, understanding fundamental concepts is paramount. Among these, the ability to calculate a percentage from two numbers stands out as a foundational skill. Far from being a mere arithmetic exercise, percentages are the lingua franca of financial literacy. They allow us to contextualize numbers, compare different values meaningfully, and gauge proportions – whether we’re evaluating interest rates, tracking investment growth, analyzing profit margins, or simply sticking to a budget. Without a solid grasp of how to derive and interpret percentages, navigating the complexities of personal finance and business economics becomes a daunting, if not impossible, task.

This comprehensive guide will demystify the process of calculating percentages, moving beyond the simple formula to explore its profound implications across various financial scenarios. We’ll delve into the foundational mathematical principles, illustrate real-world applications in both personal and business finance, highlight common pitfalls, and empower you with the knowledge to leverage this essential financial tool effectively.
The Foundational Formula: Understanding Percentage Basics
Before we can apply percentages to complex financial scenarios, it’s crucial to solidify our understanding of what a percentage truly represents and how its core formula works. This isn’t just about memorizing an equation; it’s about grasping the logic that underpins virtually all proportional financial analysis.
What Exactly is a Percentage?
The word “percentage” derives from the Latin “per centum,” meaning “by the hundred.” Fundamentally, a percentage is a way of expressing a number or a ratio as a fraction of 100. It’s a standardized way to compare parts to a whole, or to show proportional changes. For instance, if you save 10% of your income, it means for every hundred dollars you earn, you set aside ten. This standardization makes it incredibly easy to compare disparate figures, even if their underlying total values are vastly different. It transforms raw numbers into digestible insights, whether you’re comparing the return on two different investments or the sales growth of two separate quarters.
The Core Formula Unpacked
The beauty of percentage calculation lies in its elegant simplicity. To find what percentage one number (let’s call it the “part”) is of another number (the “whole” or “base”), you use the following formula:
Percentage = (Part / Whole) x 100
Let’s break down each component:
-
Part: This is the specific value or amount you are interested in expressing as a percentage. It’s the portion of the whole you’re examining.
-
Whole: This is the total, the base amount, or the reference value against which the part is being compared. It’s crucial that this number represents the entirety of what you’re measuring.
-
x 100: Multiplying the resulting decimal by 100 converts the fractional value into a percentage, representing it “out of a hundred.”
Understanding which number is the “part” and which is the “whole” is the most critical step and often where errors occur. Always ask yourself: “What am I trying to express as a proportion of what total?”
Step-by-Step Calculation Example
Let’s walk through a straightforward example relevant to personal finance. Imagine you have a monthly budget of $3,000, and you spend $750 on rent. You want to know what percentage of your budget goes towards rent.
-
Identify the “Part”: Your rent expense, which is $750.
-
Identify the “Whole”: Your total monthly budget, which is $3,000.
-
Perform the Division: $750 / $3,000 = 0.25
-
Multiply by 100: 0.25 x 100 = 25
Therefore, 25% of your monthly budget is allocated to rent. This simple calculation provides an immediate, actionable insight into your spending habits that the raw numbers alone might not convey as clearly.
Everyday Financial Applications of Percentages
The ability to calculate percentages isn’t just an academic exercise; it’s a vital life skill that impacts almost every financial decision we make. From managing household budgets to planning for retirement, percentages provide the clarity needed to make informed choices.
Personal Budgeting and Savings
Percentages are indispensable for effective personal financial management. They allow you to set clear financial goals and track your progress. For instance, the popular 50/30/20 rule (50% for needs, 30% for wants, 20% for savings and debt repayment) is entirely percentage-based. By calculating what percentage of your income goes to each category, you can quickly identify areas where you might be overspending or under-saving. If your rent is 25% of your income (as in our earlier example), and your utilities add another 10%, you immediately see that 35% of your income is dedicated to housing-related needs, allowing you to assess if this aligns with your financial goals or typical benchmarks.
Understanding Loans and Interest Rates
When you borrow money, whether for a mortgage, a car loan, or a credit card, you’re primarily concerned with the interest rate – which is always expressed as a percentage. Understanding how interest is calculated is crucial. For example, if you take out a $10,000 loan with an annual interest rate of 5%, you’ll pay $500 in interest per year ($10,000 x 0.05). Knowing how to calculate this helps you compare different loan offers, understand the true cost of borrowing, and make more strategic decisions about managing debt. A slight difference in percentage points can translate to thousands of dollars over the lifetime of a large loan.
Deciphering Investment Returns
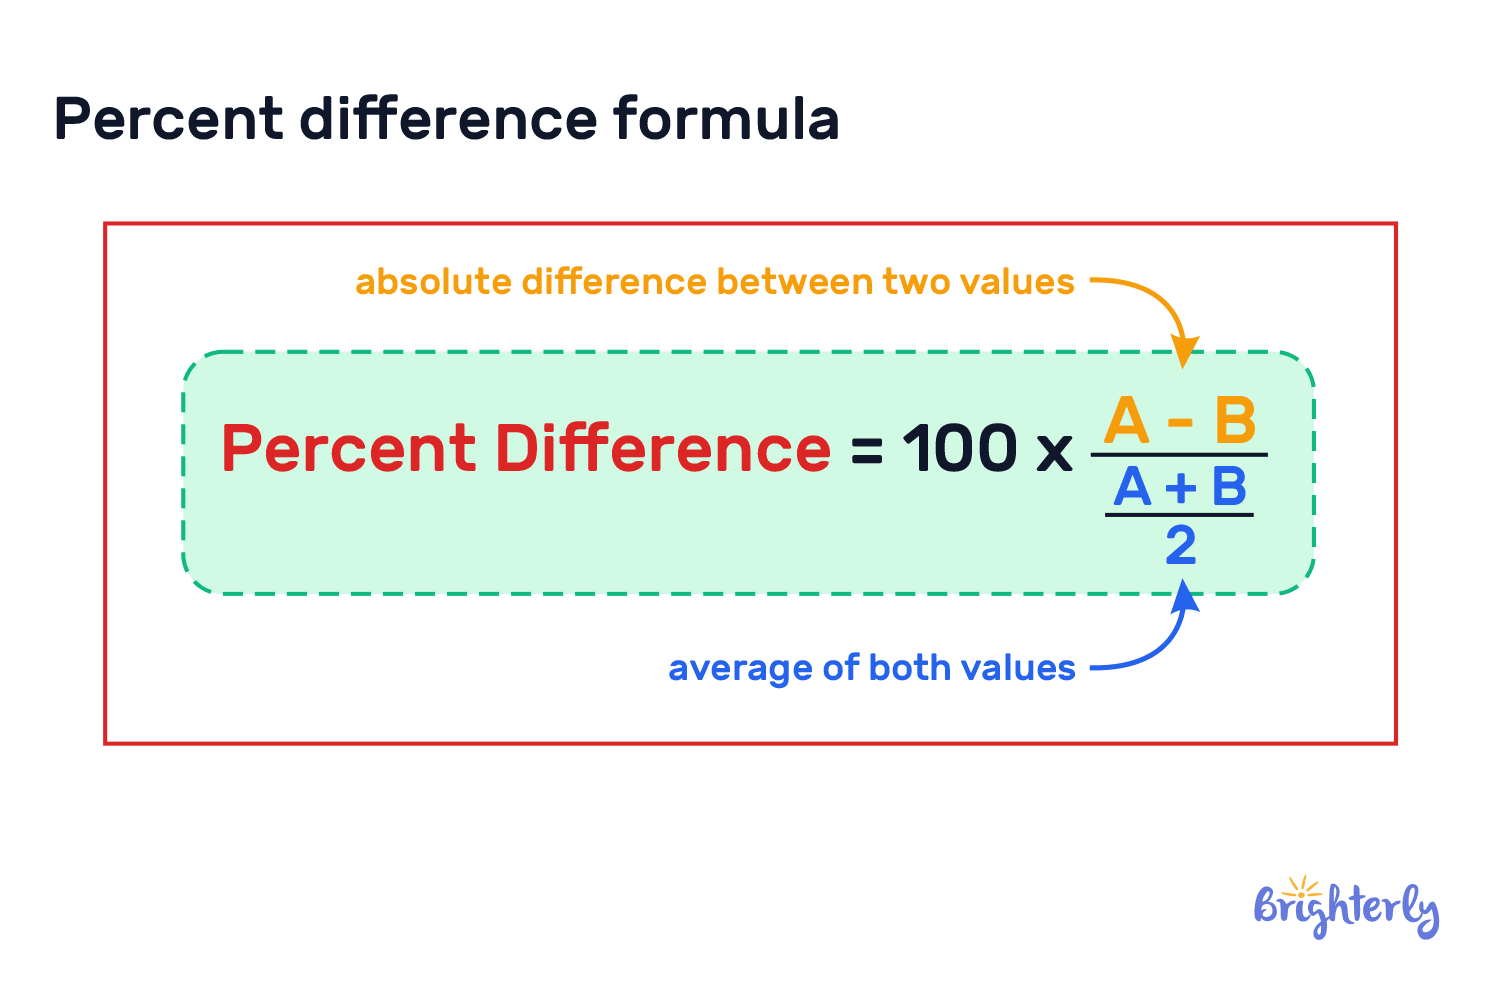
For investors, percentages are the primary metric for evaluating performance. The “return on investment” (ROI) is always expressed as a percentage, indicating the gain or loss relative to the initial investment. If you invest $1,000 and it grows to $1,150, your gain is $150. To find the percentage return: ($150 / $1,000) x 100 = 15%. This 15% figure is far more useful for comparing the success of this investment to others than the raw dollar amount alone. It allows you to assess efficiency and profitability, even across investments of different sizes.
Sales, Discounts, and Price Changes
Every time you shop, you encounter percentages. A “20% off” sale means the price has been reduced by 20% of its original value. If an item costs $50 and is 20% off, you save $10 ($50 x 0.20), paying $40. Similarly, understanding sales tax, which is also a percentage, is vital for knowing the final cost of purchases. Beyond shopping, understanding percentage increases or decreases in prices over time (inflation or deflation) helps you evaluate the purchasing power of your money and the real cost of goods.
Business Finance: Leveraging Percentages for Growth and Analysis
In the corporate world, percentages are not just useful; they are indispensable for strategic planning, operational efficiency, and financial reporting. Businesses rely heavily on percentage calculations to monitor performance, assess financial health, and make critical decisions that drive growth and profitability.
Profitability and Revenue Growth
For any business, understanding profit margins and revenue growth is paramount.
-
Gross Profit Margin: This is calculated as (Gross Profit / Revenue) x 100. It tells a company what percentage of its revenue is left after accounting for the cost of goods sold. A higher percentage indicates greater efficiency in production or purchasing.
-
Net Profit Margin: Calculated as (Net Profit / Revenue) x 100, this percentage reveals how much profit a company makes for every dollar of revenue after all expenses, including taxes, are accounted for. This is a crucial indicator of a company’s overall financial health and operational efficiency.
-
Revenue Growth: To measure how much a company’s sales have increased (or decreased) over a period, the formula is: ((Current Period Revenue – Previous Period Revenue) / Previous Period Revenue) x 100. This percentage growth rate is a key metric for investors and management to gauge market success and expansion.
Market Share and Competitive Analysis
Businesses operate in competitive environments, and understanding their position relative to rivals is critical. Market share, expressed as a percentage, helps companies gauge their standing. If the total market for a product is $10 million, and a company’s sales are $2 million, its market share is ($2 million / $10 million) x 100 = 20%. Tracking this percentage over time, and comparing it to competitors, provides invaluable insights into market penetration, brand strength, and the effectiveness of marketing strategies. It allows businesses to identify opportunities for expansion or areas where they might be losing ground.
Financial Ratios and Performance Metrics
Financial analysts and business leaders rely on a multitude of financial ratios, almost all of which are expressed as percentages, to assess a company’s liquidity, solvency, efficiency, and profitability. Examples include:
-
Debt-to-Equity Ratio: While often expressed as a decimal, it represents the proportion of debt financing relative to equity financing. A common conversion is to present it as a percentage for easier comparison, helping assess financial leverage and risk.
-
Return on Equity (ROE): Calculated as (Net Income / Shareholder Equity) x 100, this percentage measures how much profit a company generates for each dollar of shareholders’ equity. It’s a key indicator of a company’s efficiency in generating profits from the money its investors have put in.
-
Current Ratio (Liquidity): While not a percentage, understanding its components allows for a percentage-based analysis of how current assets compare to current liabilities.
-
Customer Churn Rate: (Number of Customers Lost / Total Customers at Start) x 100. This percentage indicates the rate at which customers are leaving a service or business, a vital metric for subscription-based models.
These percentage-based metrics allow stakeholders to quickly interpret complex financial data, compare performance against industry benchmarks, and make strategic decisions.
Common Pitfalls and Best Practices
While calculating percentages seems straightforward, certain nuances and common errors can lead to misinterpretations with potentially significant financial consequences. Adopting best practices ensures accuracy and meaningful insights.
Misinterpreting the Base Number
The most frequent mistake in percentage calculations is incorrectly identifying the “whole” or the “base” number. For example, if an item’s price increases from $100 to $120, the increase is $20. The percentage increase is ($20 / $100) x 100 = 20%. However, if the price then decreases from $120 back to $100, the decrease is still $20, but the percentage decrease is ($20 / $120) x 100 = 16.67%. Using the original $100 as the base for the decrease would be incorrect and would lead to an inaccurate conclusion. Always be clear about what you are comparing against.
The Impact of Compounding (Briefly mention relevance)
While the basic percentage formula is simple, financial calculations often involve compounding, where percentages are applied repeatedly to an ever-growing (or shrinking) base. This is most evident in interest on savings, loans, and investment returns. Understanding compound interest requires applying the percentage formula iteratively or using specific compound interest formulas, demonstrating that even simple percentages can lead to complex and powerful effects over time. A 10% annual return isn’t just a one-time calculation; it’s a compounding force that can significantly multiply wealth over decades. Misunderstanding this can lead to underestimating debt growth or under-projecting investment potential.
Tools for Accuracy: Calculators and Spreadsheets
While mental math or a basic calculator can handle simple percentage calculations, for more complex financial scenarios, especially those involving large numbers or multiple steps, leveraging technology is a best practice.
-
Financial Calculators: Many calculators have a dedicated ‘%’ button that can simplify calculations, particularly for markups, discounts, or tax.
-
Spreadsheet Software (e.g., Excel, Google Sheets): These are invaluable for financial analysis. They allow you to set up formulas once and apply them to vast datasets, reducing errors and saving time. For example, in Excel, if you want to find the percentage of a value in cell A1 relative to a total in cell B1, you would simply type
=(A1/B1)*100into another cell. Spreadsheet software also allows for robust scenario planning and visual representation of data through charts and graphs, making financial percentages even more insightful.

Conclusion: Empowering Financial Decisions with Percentage Fluency
The ability to accurately calculate and interpret percentages from two numbers is not merely an arithmetic skill; it is a fundamental pillar of financial literacy. From the smallest personal budgeting decision to the largest corporate financial analysis, percentages provide a universal language for understanding proportion, change, and performance. By mastering this core concept, you gain the power to critically assess financial information, compare investment opportunities, manage debt effectively, and make strategic choices that align with your financial goals.
Embracing percentage fluency means moving beyond raw numbers to grasp their true significance in context. It enables you to confidently evaluate interest rates, decipher investment returns, analyze business profitability, and navigate the intricate landscape of economic data. In a world increasingly driven by data and financial metrics, a solid understanding of percentages is your indispensable tool for informed decision-making and, ultimately, for achieving financial success and security.
aViewFromTheCave is a participant in the Amazon Services LLC Associates Program, an affiliate advertising program designed to provide a means for sites to earn advertising fees by advertising and linking to Amazon.com. Amazon, the Amazon logo, AmazonSupply, and the AmazonSupply logo are trademarks of Amazon.com, Inc. or its affiliates. As an Amazon Associate we earn affiliate commissions from qualifying purchases.