
Understanding how to calculate what percentage one number is of another is not merely a mathematical exercise; it is a fundamental skill deeply embedded in personal and business finance. From evaluating investment returns to budgeting expenses, deciphering loan rates, or analyzing business profitability, percentages are the universal language of financial comparison and performance. Mastering this seemingly simple calculation unlocks a deeper comprehension of financial health, growth, and opportunity, empowering individuals and organizations to make informed decisions.
The Core Calculation: Understanding the Formula
At its heart, finding what percentage one number is of another involves a straightforward division, scaled to represent a portion of 100. This basic arithmetic operation forms the bedrock for countless financial analyses.
Basic Definition and Formula Breakdown
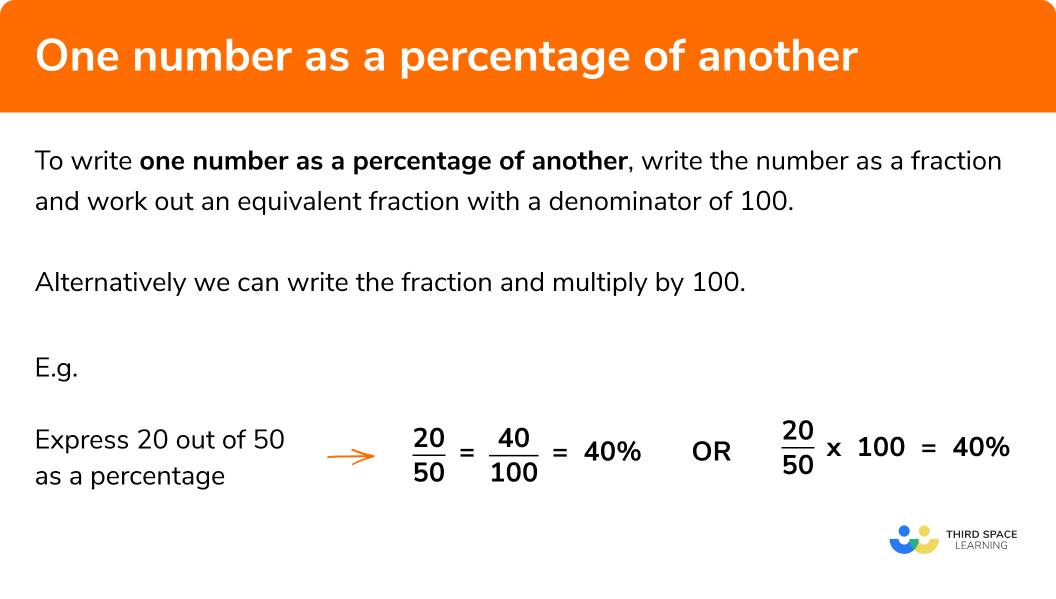
A percentage represents a part per hundred. When you want to express how much of a whole a specific part constitutes, you use percentages. The standard formula for calculating what percentage number A is of number B is:
Percentage = (Part / Whole) * 100
Here, the ‘Part’ is the specific number you are comparing, and the ‘Whole’ is the base number against which you are comparing it. Multiplying by 100 converts the decimal ratio into a percentage format.
For example, if you earned $500 (Part) from a total investment of $10,000 (Whole), your percentage return would be:
($500 / $10,000) * 100 = 0.05 * 100 = 5%
This means your earnings represent 5% of your total investment.
Practical Example: Budgeting Your Expenses
Consider a personal finance scenario: budgeting. If your monthly take-home income (Whole) is $4,000, and your rent expense (Part) is $1,200, you can determine what percentage of your income goes towards housing.
Percentage of Income for Rent = ($1,200 / $4,000) * 100 = 0.30 * 100 = 30%
This calculation immediately tells you that 30% of your income is allocated to rent. Financial advisors often suggest guidelines (like the 30% rule for housing) for various expense categories, and knowing your actual percentages allows you to compare your spending against these benchmarks, identifying areas for adjustment to improve your financial well-being.
Everyday Financial Applications of Percentages
The ability to calculate percentages transcends basic budgeting, permeating almost every aspect of daily financial interactions and long-term planning.
Navigating Discounts and Sales
From grocery stores to online retailers, sales and discounts are ubiquitous. Understanding how to calculate percentages enables savvy consumers to truly grasp the value of a deal.
Suppose an item originally costs $200 and is now on sale for $150. To find the percentage discount:
-
Calculate the discount amount:
$200 - $150 = $50 -
Apply the percentage formula:
($50 / $200) * 100 = 0.25 * 100 = 25%
The item is discounted by 25%.
Conversely, if an item is advertised with a “20% off” sticker and its original price is $50, you can calculate the final price:
-
Calculate the discount amount:
20% of $50 = (20/100) * $50 = $10 -
Subtract from the original price:
$50 - $10 = $40
The final price is $40. This skill is critical for comparing offers, verifying advertised savings, and ensuring you’re making the most cost-effective purchasing decisions.
Deciphering Interest Rates on Loans and Investments
Interest rates are perhaps one of the most significant financial applications of percentages. Whether you’re paying interest on a loan (mortgage, credit card, auto loan) or earning interest on savings or investments, understanding how percentages translate into real dollars is crucial.
For loans, an annual percentage rate (APR) indicates the yearly cost of borrowing. If you borrow $10,000 at an APR of 5%, you know that the annual interest cost is:
($10,000 * 5%) = ($10,000 * 0.05) = $500
This foundational understanding allows you to compare different loan offers effectively, identify which one will cost you less over time, and grasp the total repayment implications. Similarly, for investments, a stated interest rate or yield helps you project potential earnings and evaluate the attractiveness of various financial products like savings accounts, certificates of deposit (CDs), or bonds.
Analyzing Investment Returns and Growth
Investors constantly use percentages to evaluate the performance of their portfolios and individual assets. The “return on investment” (ROI) is a percentage that shows the profit or loss relative to the initial investment.
If you invested $1,000 and it grew to $1,150, your profit is $150.
Percentage Return = ($150 / $1,000) * 100 = 15%
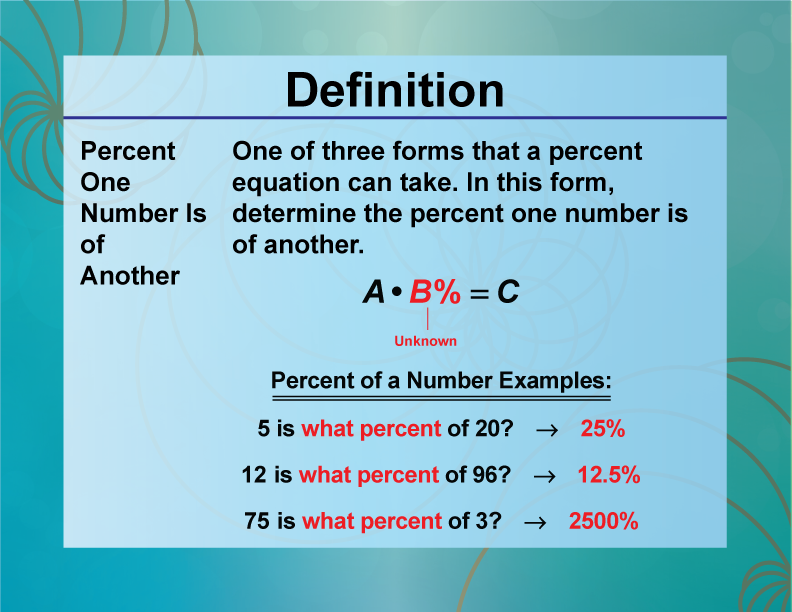
This 15% return allows for easy comparison with other investment opportunities or market benchmarks. Understanding compound annual growth rate (CAGR), which expresses the average annual growth rate over a period, also relies heavily on percentage calculations, providing a standardized metric for comparing performance across different timeframes and assets.
Business Finance: Profit Margins, Markups, and Performance
In the business world, percentages are indispensable for tracking financial health, making strategic decisions, and communicating performance to stakeholders.
Calculating Profitability: Gross vs. Net Margins
Businesses rely on profit margins to assess their financial efficiency.
-
Gross Profit Margin indicates how much money a company makes from each sale after deducting the direct costs of production (Cost of Goods Sold – COGS).
Gross Profit Margin = ( (Revenue - COGS) / Revenue ) * 100If a company sells goods for $1,000,000 (Revenue) and the COGS is $600,000, the Gross Profit is $400,000.
Gross Profit Margin = ($400,000 / $1,000,000) * 100 = 40%A higher gross margin suggests efficient production or strong pricing power.
-
Net Profit Margin goes further, showing the percentage of revenue left after all expenses, including COGS, operating expenses, interest, and taxes, have been deducted.
Net Profit Margin = (Net Profit / Revenue) * 100If the same company has a Net Profit of $150,000, its Net Profit Margin is:
($150,000 / $1,000,000) * 100 = 15%Net profit margin is a crucial indicator of a company’s overall financial health and operational efficiency, directly informing investors and management about the effectiveness of their business model.
Pricing Strategies: Understanding Markups
Businesses also use percentages to set prices effectively. A markup percentage is applied to the cost of a product to arrive at its selling price, ensuring profitability.
If a product costs a retailer $50 to acquire and they want a 30% markup, they calculate the markup amount:
Markup Amount = Cost * Markup Percentage = $50 * 0.30 = $15
Selling Price = Cost + Markup Amount = $50 + $15 = $65
Understanding markups is vital for pricing strategies, ensuring that products are priced competitively while still generating desired profit levels.
Performance Metrics: Sales Growth and Market Share
Businesses measure their growth and competitive position using percentages.
-
Sales Growth Percentage: Measures the increase or decrease in sales revenue over a specific period.
Sales Growth = ( (Current Period Sales - Previous Period Sales) / Previous Period Sales ) * 100If sales increased from $1,000,000 last year to $1,200,000 this year, the sales growth is:
( ($1,200,000 - $1,000,000) / $1,000,000 ) * 100 = 20%This metric is a key indicator of a company’s expansion and market acceptance.
-
Market Share: Represents a company’s sales as a percentage of the total sales for its industry.
Market Share = (Company's Sales / Total Industry Sales) * 100If a company sells $50,000,000 in a market with total sales of $500,000,000, its market share is:
($50,000,000 / $500,000,000) * 100 = 10%Tracking market share helps businesses understand their competitive standing and evaluate the effectiveness of their marketing and sales strategies.
Personal Finance Beyond the Basics
Beyond day-to-day spending and investing, percentages are instrumental in assessing broader financial health and planning for the future.
Debt-to-Income Ratios and Financial Health
Lenders frequently use the debt-to-income (DTI) ratio, a percentage, to evaluate an applicant’s ability to manage monthly payments and repay debts.
DTI Ratio = (Total Monthly Debt Payments / Gross Monthly Income) * 100
If your total monthly debt payments (credit cards, loans) are $800 and your gross monthly income is $4,000, your DTI is:
($800 / $4,000) * 100 = 20%
A lower DTI indicates a healthier financial position, making it easier to secure new loans or mortgages. Understanding and managing this percentage is critical for maintaining good credit and financial stability.
Savings Rates and Retirement Planning
Planning for retirement and other long-term goals hinges on your savings rate – the percentage of your income you save.
Savings Rate = (Monthly Savings / Monthly Income) * 100
If you save $500 from your $4,000 monthly income, your savings rate is:
($500 / $4,000) * 100 = 12.5%
Financial experts often recommend saving 10-15% or more of your income for retirement. Calculating your personal savings rate allows you to benchmark your progress and adjust your financial habits to meet your long-term goals.
Understanding Tax Implications
Taxes, by their very nature, are percentage-based. Income tax rates, sales tax, property tax rates – all are expressed as percentages. Understanding how these percentages apply to your income, purchases, or assets helps in budgeting for tax liabilities, estimating take-home pay, and optimizing financial decisions to minimize tax burdens where possible. For instance, knowing your effective tax rate (total tax paid as a percentage of total income) gives a clearer picture than just looking at marginal tax brackets.
Tools and Technologies for Percentage Calculations
While the basic formula is simple, modern financial management benefits greatly from tools that automate and visualize these calculations.
Spreadsheets and Financial Software
Spreadsheet programs like Microsoft Excel or Google Sheets are incredibly powerful for percentage calculations. They allow users to set up complex financial models, track budgets, analyze investment portfolios, and calculate various financial ratios automatically. By inputting raw numbers, formulas can instantly generate percentages, update charts, and perform scenario analyses. Similarly, dedicated financial software and accounting platforms for businesses often have built-in functions to display data as percentages, simplifying reporting and analysis.

Online Calculators and Mobile Apps
For quick, on-the-go calculations, numerous online percentage calculators and mobile apps are available. These tools can rapidly compute discounts, tips, loan interest, and more, serving as convenient aids for everyday financial decisions. While they handle the mechanics, understanding the underlying percentage concept remains vital for interpreting the results and applying them wisely.
In conclusion, the ability to find what percentage one number is of another is far more than a basic math skill; it is an indispensable financial competency. It provides the clarity needed to navigate personal budgets, evaluate investment opportunities, drive business profitability, and plan for a secure financial future. Embracing and applying this fundamental calculation empowers individuals and businesses alike to make smarter, more strategic financial choices.
aViewFromTheCave is a participant in the Amazon Services LLC Associates Program, an affiliate advertising program designed to provide a means for sites to earn advertising fees by advertising and linking to Amazon.com. Amazon, the Amazon logo, AmazonSupply, and the AmazonSupply logo are trademarks of Amazon.com, Inc. or its affiliates. As an Amazon Associate we earn affiliate commissions from qualifying purchases.