
The Financial Imperative: Why Understanding Decrease Percentage Matters
In the world of finance, numbers tell stories. While growth and increase often capture the headlines, understanding and calculating a decrease percentage is equally, if not more, critical for astute financial management, strategic investing, and sound business decisions. Whether you’re a meticulous budgeter, a savvy investor, or an entrepreneur navigating market fluctuations, the ability to quantify reductions provides invaluable insights. It helps to identify trends, measure the impact of financial events, and assess performance accurately, painting a realistic picture of economic health or operational efficiency.
For individuals, a decrease percentage might reveal the extent of a portfolio drawdown, the reduction in a monthly utility bill due to conservation efforts, or the dip in income from a side hustle. For businesses, it could signify a drop in quarterly sales, a decrease in production costs, or a contraction in market share. In each scenario, the raw numbers alone don’t always convey the full impact; a percentage contextualizes the change relative to its starting point, allowing for meaningful comparisons and proactive responses. Without this vital metric, financial analysis remains incomplete, hindering effective planning and risk mitigation.
Mastering the Formula: Step-by-Step Calculation
Calculating a decrease percentage is a straightforward mathematical process, yet its application across various financial contexts offers profound insights. The core formula remains consistent, providing a universal method to quantify any reduction from an initial value.
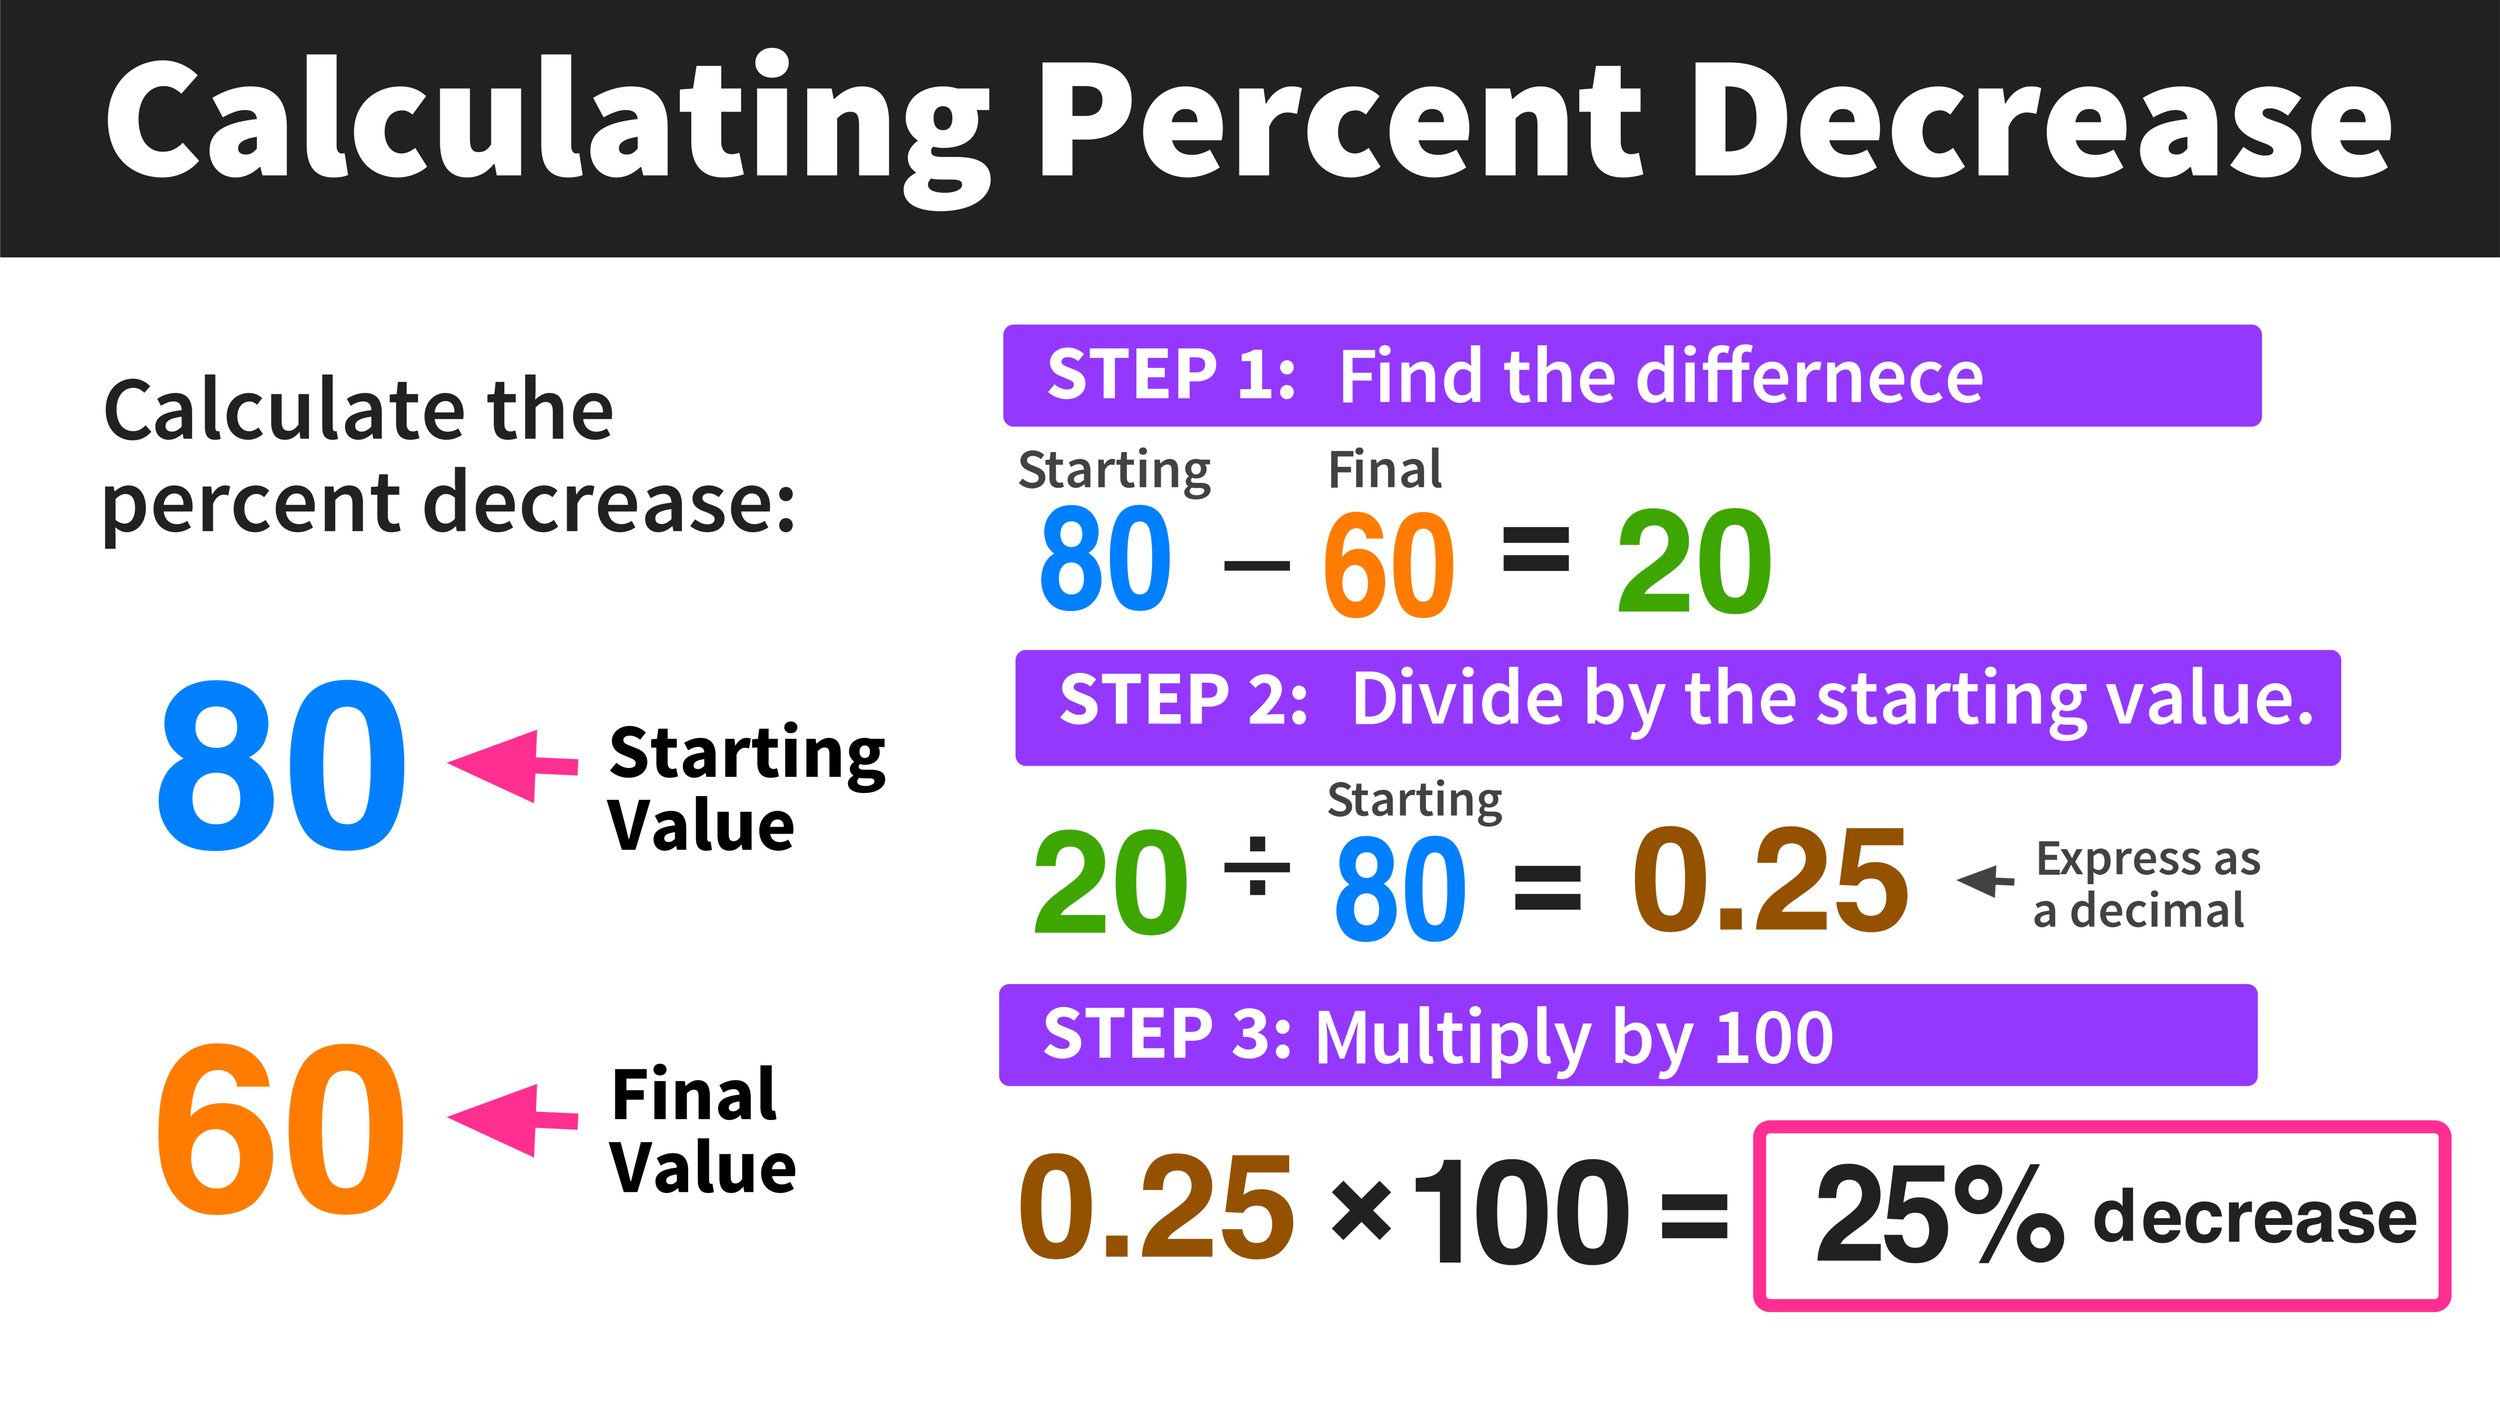
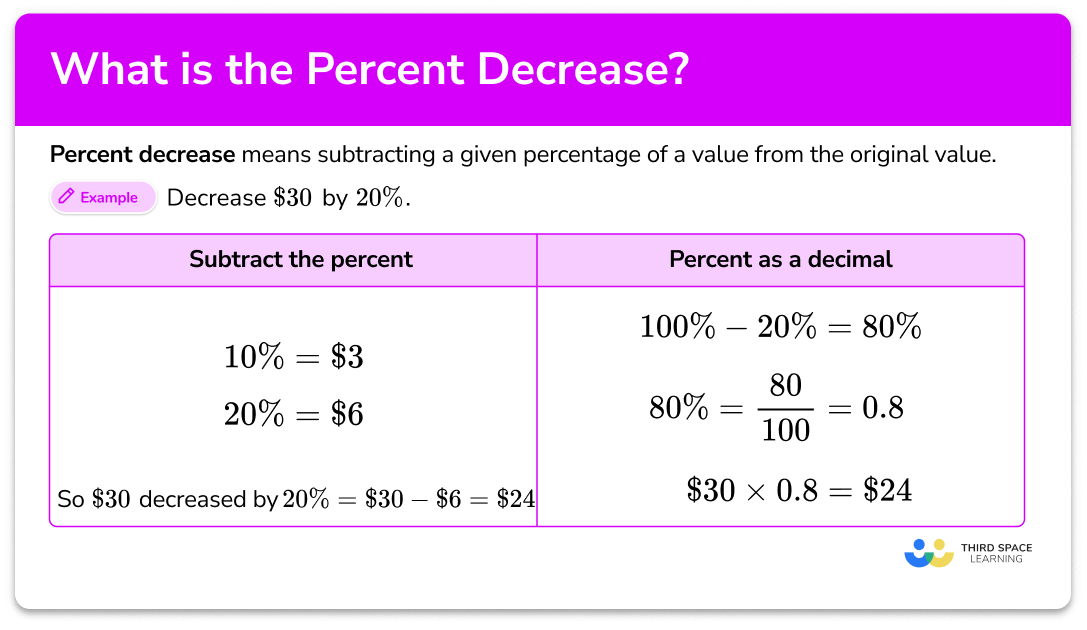
The Core Formula: (Original Value – New Value) / Original Value * 100%
To break it down:
-
Find the Difference: Subtract the new, smaller value from the original, larger value. This gives you the absolute amount of the decrease.
-
Divide by the Original: Take that absolute decrease and divide it by the original value. This step converts the decrease into a decimal fraction relative to the starting point.
-
Multiply by 100: To express this decimal as a percentage, multiply the result by 100.
Let’s illustrate this with practical financial examples.
Walkthrough Example 1: Investment Portfolio Decline
Imagine you started the year with an investment portfolio valued at $50,000 (Original Value). Due to market volatility, by mid-year, its value has fallen to $42,500 (New Value). How do you calculate the percentage decrease?
-
Find the Difference: $50,000 (Original) – $42,500 (New) = $7,500 (Absolute Decrease)
-
Divide by the Original: $7,500 / $50,000 = 0.15
-
Multiply by 100: 0.15 * 100 = 15%
Therefore, your investment portfolio experienced a 15% decrease. This metric is far more telling than just knowing it dropped by $7,500, especially when comparing it to other investments or market benchmarks.
Walkthrough Example 2: Expense Reduction for Budgeting
Suppose your average monthly utility bill was $200 (Original Value). After implementing energy-saving measures, your latest bill comes in at $160 (New Value). What is your percentage decrease in utility costs?
-
Find the Difference: $200 (Original) – $160 (New) = $40 (Absolute Decrease)
-
Divide by the Original: $40 / $200 = 0.20
-
Multiply by 100: 0.20 * 100 = 20%
You successfully achieved a 20% decrease in your utility expenses. This percentage provides clear evidence of the effectiveness of your energy-saving strategies, helping you evaluate your budgeting efforts.
Practical Applications in Personal Finance
For individuals striving for financial independence and stability, understanding percentage decrease is not merely an academic exercise; it’s a vital tool for informed decision-making and strategic planning across various personal finance domains.
Assessing Investment Drawdowns and Losses
In the volatile world of investing, drawdowns are an inevitable part of the journey. A drawdown refers to the peak-to-trough decline in the value of an investment or trading account. Calculating the percentage decrease during these periods is crucial for risk management and emotional fortitude. If your stock portfolio, which once peaked at $100,000, drops to $75,000, you’ve experienced a 25% decrease. This percentage helps you put the loss into perspective, compare it against historical market corrections, and evaluate your risk tolerance. It informs decisions about whether to hold, buy more, or rebalance your assets, preventing panic selling based solely on absolute dollar figures. Similarly, understanding the percentage decrease in a single stock’s value allows you to objectively analyze its performance against its sector or broader market indices, guiding your decisions on when to cut losses or average down.
Monitoring Income Fluctuations and Savings Rate Changes
Life circumstances can lead to fluctuations in income, from salary adjustments to reduced hours or a downturn in freelance work. Calculating the percentage decrease in your monthly or annual income provides a clear picture of the impact on your cash flow. For instance, if your net monthly income drops from $5,000 to $4,500, that’s a 10% decrease. This knowledge immediately highlights the necessity of adjusting your budget and expenditure to maintain financial stability.

Concurrently, tracking the percentage decrease in your savings rate is equally important. If your goal is to save 15% of your income but a new expense or reduced income forces you to save only 10%, that represents a significant percentage decrease in your savings rate, signaling a need for intervention. This proactive monitoring allows you to make necessary adjustments to stay on track with long-term financial goals, such as retirement planning or a down payment on a house.
Strategic Budgeting: Identifying and Reducing Spending
Budgeting is fundamentally about managing money, and a key aspect is identifying areas where spending can be reduced. The decrease percentage is an invaluable tool here. By comparing current spending categories to previous periods, you can quantify the effectiveness of your cost-cutting efforts. Did you reduce your dining-out budget from $400 to $250? That’s a 37.5% decrease, a clear win. Did your entertainment expenses go from $150 to $100? That’s a 33.3% decrease. These percentages highlight successes and pinpoint areas where further reductions might be possible or necessary. They provide tangible proof of progress, motivating continued adherence to your budget and helping you reallocate saved funds towards higher-priority financial goals like debt repayment or increased investments.
Strategic Insights for Business and Entrepreneurship
For businesses, regardless of size, the decrease percentage is a vital diagnostic tool that informs operational strategies, financial forecasting, and competitive positioning. It provides clarity on performance issues and opportunities for improvement.
Analyzing Revenue Dips and Profitability Changes
One of the most immediate applications of decrease percentage in business finance is monitoring revenue. A quarter-over-quarter or year-over-year decrease in sales revenue, when expressed as a percentage, provides a critical benchmark for evaluating the health of the business. If monthly revenue falls from $100,000 to $80,000, that’s a 20% decrease, triggering a need to investigate market conditions, sales strategies, or product demand.
Similarly, profitability is paramount. A decrease in net profit margin—even if revenue holds steady—can indicate rising costs or inefficiencies. If last year’s net profit was $20,000 on $100,000 revenue (20% margin), and this year it’s $15,000 on the same revenue (15% margin), that’s a 25% decrease in profit and a 5 percentage point drop in margin. Understanding these percentage shifts allows management to pinpoint whether the issue is pricing, cost of goods sold, or operating expenses, guiding decisions on pricing adjustments, supplier negotiations, or overhead reductions.
Cost Management and Operational Efficiency
Businesses constantly seek to optimize operations and manage costs effectively. The decrease percentage is instrumental in measuring the success of cost-cutting initiatives. For example, if a company’s manufacturing costs per unit drop from $10 to $8 after investing in new machinery, that represents a 20% decrease in unit cost—a significant improvement in operational efficiency.
Tracking decreases in specific expenditure categories, such as marketing spend, administrative overhead, or utility bills, can reveal opportunities for greater efficiency. If a new software system reduces the time spent on a task by 30%, that translates into a percentage decrease in labor cost for that specific task, directly impacting the bottom line. These granular insights enable businesses to make data-driven decisions about resource allocation, technology adoption, and process improvements, leading to enhanced profitability and competitiveness.
Evaluating Market Performance and Competitive Standing
Beyond internal metrics, the decrease percentage helps businesses assess their external performance. A decrease in market share, for instance, from 15% to 12% in a particular product category, represents a 20% decrease in market penetration (calculated as (15-12)/15 * 100%). This alarming signal can prompt a strategic review of marketing efforts, product development, or competitive pricing strategies.
Similarly, a decrease in customer acquisition costs or customer churn rates (the percentage of customers who stop using a product or service) can be a positive indicator of improved customer satisfaction or marketing effectiveness. Conversely, an increase in churn would be a negative percentage increase, indicating problems. By analyzing these percentage changes, businesses can understand their position relative to competitors, identify threats, and capitalize on opportunities within the marketplace.
Tools, Traps, and Nuances in Financial Analysis
While the formula for calculating decrease percentage is simple, its effective application in financial analysis requires the right tools, an awareness of common pitfalls, and a deep appreciation for context.
Leveraging Spreadsheets and Financial Calculators
For individual financial management and small business operations, spreadsheet programs like Microsoft Excel or Google Sheets are indispensable tools. They allow for easy input of data, automated calculations, and visual representation of trends over time. Functions like =(OLD_VALUE - NEW_VALUE) / OLD_VALUE can be embedded into cells, simplifying complex analyses across numerous data points. Many online financial calculators also offer direct percentage change functions, making quick calculations accessible even for those less familiar with spreadsheets. For more advanced needs, dedicated financial software or enterprise resource planning (ERP) systems can integrate these calculations into broader reporting dashboards, offering real-time insights into various financial metrics.
Common Mistakes and Misinterpretations
One of the most common mistakes is confusing the decrease percentage with an absolute percentage point change. For example, if a stock’s percentage ownership in a company drops from 20% to 15%, that’s a 5 percentage point decrease, but it’s a 25% decrease in the amount of ownership (i.e., (20-15)/20 * 100%). Understanding this distinction is crucial to avoid misinterpreting data.
Another pitfall is focusing solely on the percentage without considering the absolute values involved. A 50% decrease in a $10 expense is far less impactful than a 10% decrease in a $100,000 investment, even though the former percentage is higher. Always look at both the percentage and the underlying dollar amounts. Furthermore, be wary of negative numbers in the original value, as the formula assumes a positive starting point.
The Importance of Context and Timeframes
The decrease percentage is most meaningful when viewed within its appropriate context and timeframe. A 5% decrease in quarterly revenue might be concerning, but if it follows a record-breaking quarter and is still above the annual average, its impact may be less severe than if it were part of a sustained downward trend. Comparing current decreases to historical averages, industry benchmarks, or specific events (like a product recall or a market crash) provides crucial perspective.
Defining the timeframe is also critical. Is the decrease calculated daily, weekly, monthly, annually, or over a multi-year period? A day-to-day fluctuation might be noise, whereas an annual percentage decrease could indicate a significant shift. Consistent use of timeframes ensures that comparisons are apples-to-apples, leading to more accurate analysis and better-informed financial decisions. Always ask: “Decrease from what, over what period, and why?” to unlock the full story behind the numbers.
aViewFromTheCave is a participant in the Amazon Services LLC Associates Program, an affiliate advertising program designed to provide a means for sites to earn advertising fees by advertising and linking to Amazon.com. Amazon, the Amazon logo, AmazonSupply, and the AmazonSupply logo are trademarks of Amazon.com, Inc. or its affiliates. As an Amazon Associate we earn affiliate commissions from qualifying purchases.