
In the complex tapestry of personal finance, investing, and business management, numbers tell a story. But raw numbers alone often lack the context needed for meaningful interpretation. This is where percentages step in, transforming isolated figures into powerful indicators of proportion, performance, and potential. Understanding how to find a percentage from a total is not merely a mathematical exercise; it’s a fundamental skill that empowers individuals and businesses to make informed decisions, track progress, and navigate the financial landscape with clarity and confidence.
Whether you’re scrutinizing your monthly budget, evaluating investment returns, dissecting a company’s profit margins, or simply trying to understand the breakdown of your expenses, the ability to convert a part into a percentage of a whole is indispensable. It allows for standardized comparison, revealing insights that might otherwise remain obscured. This article delves into the crucial importance of percentages in financial contexts, breaks down the core calculations, explores their diverse applications, highlights common pitfalls, and guides you towards leveraging digital tools for precision and efficiency. Mastering this skill is akin to equipping yourself with a powerful compass in the vast ocean of finance, ensuring you always know where you stand and where you’re headed.
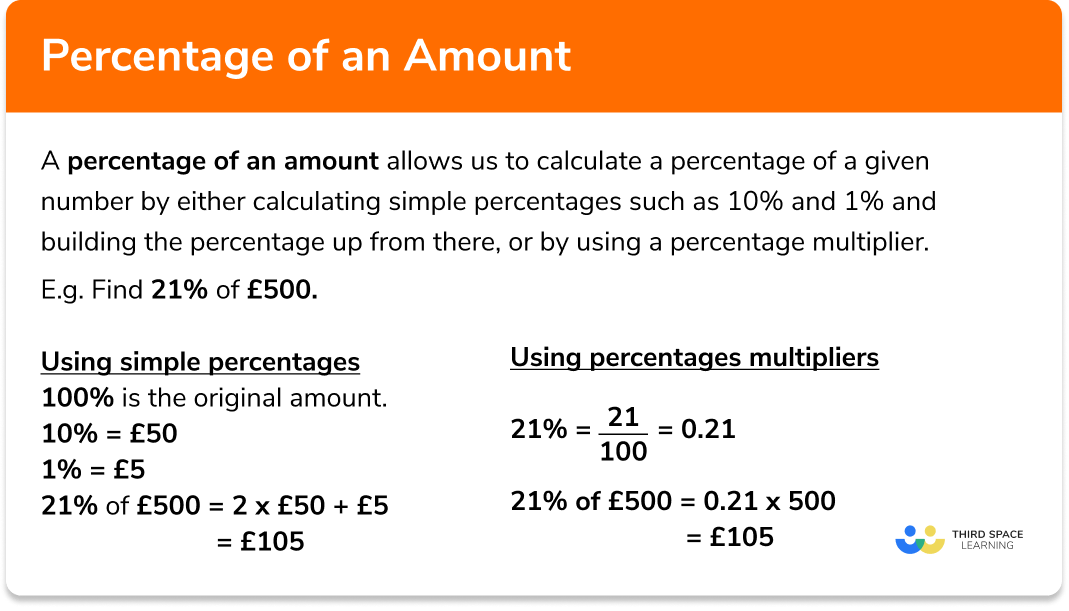
The Indispensable Role of Percentages in Financial Literacy
At its core, financial literacy is about understanding how money works, how to manage it, and how to make it work for you. Percentages are the bedrock of this understanding, providing a universal language to quantify relationships between numbers. They strip away the absolute scale of figures, allowing us to compare apples to oranges, or rather, a small personal budget to a multi-million-dollar corporate financial statement, on a proportional basis.
Beyond Simple Numbers: Unveiling True Financial Health
Imagine you’ve saved $500 this month. Is that good? On its own, $500 provides limited insight. However, if that $500 represents 15% of your after-tax income, suddenly it becomes a potent indicator of your saving discipline and financial health. Similarly, a company reporting $1 million in profit sounds impressive, but if that’s only 2% of its total revenue, it suggests very slim margins, which could be a cause for concern. Percentages provide the “how much relative to what” context that raw numbers inherently lack. They enable us to benchmark against industry standards, personal goals, or historical performance, providing a deeper, more nuanced understanding of financial realities. They help us answer critical questions: What portion of my income goes to housing? What percentage of my portfolio is allocated to high-growth stocks? What share of the market does my business command? Without percentages, these vital questions would remain unanswered, leaving financial decisions to guesswork rather than data-driven insight.
From Personal Budgets to Investment Portfolios: Ubiquitous Application
The application of percentages permeates every facet of the financial world. For personal finance, percentages are critical for budgeting (e.g., the 50/30/20 rule for needs, wants, and savings), tracking expenses (e.g., what percentage of your spending is on discretionary items?), and understanding debt (e.g., interest rates, debt-to-income ratios). In investing, they are fundamental for calculating returns on investment (ROI), understanding asset allocation (e.g., what percentage of your portfolio is in equities vs. bonds), assessing risk, and determining dividend yields. For businesses, percentages are essential for calculating profit margins, revenue growth, market share, discount rates, and operational efficiency ratios. From the individual trying to save for retirement to the multinational corporation analyzing quarterly earnings, percentages serve as the lingua franca for financial communication and analysis, making them an absolutely indispensable tool in anyone’s financial arsenal.
Mastering the Core Formula: Finding Your Financial Snapshot
At the heart of every percentage calculation lies a simple, yet powerful, mathematical formula. Understanding and internalizing this formula is the first step towards confidently applying percentages across all your financial endeavors. It’s the foundational skill that unlocks a world of financial understanding and empowers you to derive meaningful insights from raw data.
The Fundamental Percentage Equation: Part/Total x 100
The formula to find a percentage is straightforward:
Percentage = (Part / Total) × 100
Let’s break down each component:
-
Part: This is the specific amount or quantity you want to express as a percentage. It’s the portion of the whole you’re interested in.
-
Total: This is the entire amount or quantity, the whole group or sum against which the part is being compared.
-
100: Multiplying by 100 converts the resulting decimal or fraction into a percentage, making it easier to read and interpret.
Consider an example: You spent $300 on groceries last month, and your total monthly expenses were $2,000.
To find out what percentage of your total expenses went to groceries:
Part = $300 (groceries)
Total = $2,000 (total expenses)
Percentage = ($300 / $2,000) × 100
Percentage = 0.15 × 100
Percentage = 15%
This tells you that 15% of your total expenses were dedicated to groceries, a clear and actionable piece of information for budgeting.
Practical Examples: Calculating Spending Ratios and Debt-to-Income
Let’s apply this to common financial scenarios:
1. Spending Ratios:
Suppose your monthly take-home income is $4,000. You spend $1,200 on rent, $600 on transportation, and $400 on entertainment.
-
Rent as a percentage of income: ($1,200 / $4,000) × 100 = 30%
-
Transportation as a percentage of income: ($600 / $4,000) × 100 = 15%
-
Entertainment as a percentage of income: ($400 / $4,000) × 100 = 10%
These percentages help you visualize where your money is going relative to your income and assess if your spending aligns with your financial goals (e.g., the commonly recommended 30% for housing).
2. Debt-to-Income (DTI) Ratio:
Lenders often use the Debt-to-Income (DTI) ratio to assess your ability to manage monthly payments and repay debts.
Suppose your total monthly debt payments (credit cards, loans, mortgage) are $1,500, and your gross monthly income is $5,000.
DTI Percentage = (Total Monthly Debt Payments / Gross Monthly Income) × 100
DTI Percentage = ($1,500 / $5,000) × 100
DTI Percentage = 0.30 × 100
DTI Percentage = 30%
A DTI of 30% is generally considered healthy, indicating you have a manageable amount of debt relative to your income. Understanding this percentage is crucial for managing your credit and qualifying for loans.
By consistently applying this fundamental formula, you gain the power to break down complex financial data into digestible, comparable proportions, offering a clear snapshot of your financial health and progress.
Applying Percentages Across Diverse Financial Scenarios
The power of percentages truly shines in their versatility across various financial domains. From the highly personal sphere of managing your household budget to the intricate world of investment analysis and the strategic planning of business finance, percentages provide a consistent and effective language for measurement, evaluation, and forecasting.
Personal Finance: Budgeting, Savings Rates, and Expense Tracking

In personal finance, percentages are the backbone of effective money management. They allow you to define and stick to a budget, gauge your savings progress, and pinpoint spending habits.
-
Budgeting: The “50/30/20 rule” (50% for needs, 30% for wants, 20% for savings and debt repayment) is a prime example of a percentage-based budgeting framework. By converting your income and expenses into percentages, you can quickly assess if you’re adhering to these guidelines or if adjustments are needed. For instance, if your housing costs are 40% of your income, you know you’re exceeding the recommended 50% “needs” portion, leaving less for other essential categories.
-
Savings Rates: Calculating your personal savings rate – the percentage of your income you save – is a critical metric for long-term financial health. If you earn $5,000 a month and save $1,000, your savings rate is ($1,000 / $5,000) * 100 = 20%. Tracking this percentage over time helps you ensure you’re on track for retirement, a down payment, or other significant financial goals.
-
Expense Tracking: By calculating the percentage each expense category represents out of your total spending, you can easily identify areas where you might be overspending or where cuts could be made. Is eating out consuming 25% of your discretionary budget? Perhaps it’s time to re-evaluate.
Investing: Understanding Returns, Diversification, and Risk Allocation
For investors, percentages are the language of performance and portfolio management.
-
Returns on Investment (ROI): The most common use is calculating ROI, which measures the profitability of an investment relative to its cost. If you invested $10,000 and it grew to $11,500, your return is ($1,500 / $10,000) * 100 = 15%. This percentage allows for easy comparison between different investment opportunities, regardless of their initial cost.
-
Portfolio Diversification: A well-diversified portfolio spreads investments across various asset classes (stocks, bonds, real estate) and sectors to mitigate risk. Percentages are vital for monitoring your asset allocation. For example, you might aim for 60% stocks, 30% bonds, and 10% real estate. Regularly calculating these percentages helps you rebalance your portfolio to maintain your desired risk profile.
-
Risk Allocation: Related to diversification, understanding the percentage of your portfolio exposed to higher-risk assets versus lower-risk assets is crucial for managing overall investment risk and ensuring it aligns with your personal risk tolerance.
Business Finance: Profit Margins, Growth Rates, and Cost Analysis
In the business world, percentages are foundational for strategic planning, performance evaluation, and financial reporting.
-
Profit Margins: Gross profit margin (Gross Profit / Revenue) and Net profit margin (Net Income / Revenue) are critical indicators of a company’s profitability and operational efficiency. A high net profit margin, for instance, suggests efficient cost management.
-
Growth Rates: Businesses constantly track percentage growth in revenue, customer base, or market share to assess performance and project future trends. A 10% year-over-year revenue growth provides a clear metric for stakeholders.
-
Cost Analysis: Understanding what percentage each operational cost (e.g., raw materials, labor, marketing) represents out of total expenses allows businesses to identify areas for cost reduction, improve efficiency, and optimize resource allocation. For example, if labor costs are 45% of total operating expenses, management might investigate automation or productivity enhancements.
-
Market Share: Calculating a company’s market share (Company Sales / Total Market Sales) as a percentage helps businesses understand their competitive position and strategic standing within an industry.
Across all these financial landscapes, percentages transform raw data into actionable intelligence, enabling more precise analysis and better decision-making.
Common Pitfalls and Advanced Considerations in Percentage Calculations
While the basic percentage formula is straightforward, real-world financial applications often introduce nuances and potential pitfalls that can lead to misinterpretations if not handled carefully. Being aware of these advanced considerations can significantly enhance the accuracy and insight derived from your percentage calculations.
The Peril of Basis Points vs. Percentage Points: Precision Matters
One common area of confusion, especially in investment and economic analysis, is the distinction between “percentage points” and “basis points” when discussing changes.
-
Percentage Points: This refers to the simple arithmetic difference between two percentages. For example, if an interest rate increases from 4% to 5%, it has increased by 1 percentage point.
-
Basis Points (bps): A basis point is one-hundredth of a percentage point (0.01%). There are 100 basis points in 1 percentage point. So, an increase from 4% to 5% is an increase of 100 basis points.
The confusion arises when someone says “interest rates increased by 1%.” This could mean an increase from 4% to 5% (a 1 percentage point increase) or it could mean a 1% relative increase on the original 4%, resulting in 4% + (4% * 0.01) = 4.04% (a much smaller change). In finance, precision is paramount. Using “percentage points” or “basis points” when discussing absolute changes in percentages helps avoid ambiguity, especially in sensitive contexts like interest rates, bond yields, or market share shifts.
Understanding Percentage Change vs. Percentage of a Total
Another critical distinction is between finding a “percentage of a total” (which is what we’ve primarily discussed) and calculating a “percentage change.”
-
Percentage of a Total: This determines what proportion a part makes up of a whole at a specific point in time (e.g., your rent is 30% of your income).
-
Percentage Change: This measures the relative increase or decrease of a quantity over time. The formula for percentage change is:
Percentage Change = [(New Value – Old Value) / Old Value] × 100
For example, if an investment grew from $10,000 to $12,000:
Percentage Change = [($12,000 – $10,000) / $10,000] × 100
Percentage Change = ($2,000 / $10,000) × 100
Percentage Change = 0.20 × 100 = 20% increase.
Conversely, if it dropped from $10,000 to $8,000:
Percentage Change = [($8,000 – $10,000) / $10,000] × 100
Percentage Change = (-$2,000 / $10,000) × 100
Percentage Change = -0.20 × 100 = -20% decrease.
Confusing these two concepts can lead to significant errors in financial analysis. For instance, knowing that your marketing budget is 10% of your revenue is different from understanding that your marketing spend increased by 10% from last year. Both are important percentages, but they convey different types of information.
Inflation, Compounding, and Their Percentage Impact
Advanced financial considerations often involve the cumulative effect of percentages over time, particularly with inflation and compounding.
-
Inflation: Inflation erodes purchasing power, and its impact is always expressed as a percentage. Understanding how a 3% annual inflation rate affects the real value of your savings or investments over several years requires compound percentage calculations, where the percentage reduction applies to an ever-decreasing real value.
-
Compounding: This is the process where the earnings from an investment are reinvested to generate additional earnings. Compound interest is perhaps the most powerful force in finance, often described as the “eighth wonder of the world.” If you earn 7% annually on an investment, that 7% is applied not just to your initial principal but also to all the accumulated interest from previous periods. Understanding how these percentages build upon each other over time is crucial for long-term financial planning, especially in retirement savings and debt management.
Navigating these nuances with care ensures that your percentage calculations provide truly accurate and insightful financial intelligence, preventing costly misunderstandings.
Empowering Your Financial Journey with Digital Tools
While manual calculations are excellent for understanding the fundamental principles, modern financial management benefits immensely from the efficiency and accuracy of digital tools. Leveraging these resources can streamline your percentage calculations, reduce errors, and provide dynamic visualizations of your financial data.
Spreadsheets and Financial Calculators: Automation for Accuracy
For anyone dealing with even moderately complex financial data, spreadsheets like Microsoft Excel, Google Sheets, or Apple Numbers are indispensable. They automate percentage calculations with simple formulas, allowing you to:
-
Set up dynamic budgets: Link expense categories to income and automatically calculate percentages as figures change.
-
Track investment performance: Input purchase prices, current values, and dividends, and have ROI percentages update instantly.
-
Perform “what-if” scenarios: Easily adjust variables (e.g., increasing income, reducing an expense) to see the immediate percentage impact on your financial ratios.
The built-in percentage functions and ability to copy formulas across cells make spreadsheets incredibly powerful for managing and analyzing financial data on an ongoing basis.
Online financial calculators are also incredibly useful for quick, specific percentage tasks without setting up a full spreadsheet. You can find specialized calculators for:
-
Mortgage payments and amortization schedules (showing principal vs. interest percentages)
-
Loan interest calculations
-
Retirement savings projections (factoring in compound interest percentages)
-
Debt payoff scenarios
These tools simplify complex percentage-based calculations and provide immediate answers, which is especially helpful when comparing different financial products or planning for specific milestones.

Dedicated Financial Apps and Software: Visualizing Your Percentages
Beyond spreadsheets and simple calculators, a plethora of dedicated financial apps and software (e.g., Mint, YNAB, Personal Capital, Quicken) have revolutionized how individuals and businesses manage their money. These platforms excel at:
-
Automated categorization and percentage breakdowns: Many apps automatically categorize your transactions from linked bank accounts and credit cards, then present your spending as easy-to-understand percentage pie charts or bar graphs. This visual representation makes it effortless to see what percentage of your income goes to housing, food, transportation, etc., at a glance.
-
Net worth tracking: These tools often aggregate all your assets and liabilities, calculating your net worth and showing the percentage contribution of each asset class or the percentage of your overall wealth held in different investments.
-
Investment portfolio analysis: Advanced financial software provides detailed breakdowns of your investment portfolio by asset class, industry, or geography, displaying these allocations as percentages. This helps investors ensure their diversification aligns with their risk tolerance and financial strategy, identifying when rebalancing is needed.
-
Goal tracking: You can set financial goals (e.g., save $10,000 for a down payment), and the apps will show you what percentage of your goal you have achieved, motivating continued progress.
By embracing these digital tools, you not only ensure the accuracy of your percentage calculations but also gain powerful visual insights into your financial situation, making the often-daunting task of money management more intuitive and engaging. These tools serve as an extension of your financial literacy, empowering you to effectively navigate and optimize your financial journey.
In conclusion, understanding how to find a percentage from a total is far more than a basic math lesson; it’s a critical competency for anyone seeking to master their financial world. From the smallest personal budget to the largest corporate balance sheet, percentages provide the necessary context to transform raw numbers into meaningful insights. By grasping the core formula, applying it across diverse financial scenarios, being mindful of common pitfalls, and leveraging the power of digital tools, you equip yourself with an invaluable skill. This proficiency allows you to make clearer decisions, set more realistic goals, and ultimately achieve greater financial well-being and success.
aViewFromTheCave is a participant in the Amazon Services LLC Associates Program, an affiliate advertising program designed to provide a means for sites to earn advertising fees by advertising and linking to Amazon.com. Amazon, the Amazon logo, AmazonSupply, and the AmazonSupply logo are trademarks of Amazon.com, Inc. or its affiliates. As an Amazon Associate we earn affiliate commissions from qualifying purchases.