
Understanding how to calculate a percentage total is a fundamental skill that underpins sound financial decision-making, whether for personal budgeting, investment analysis, or robust business management. Percentages offer a standardized way to compare parts to a whole, track growth, assess decline, and allocate resources effectively. Mastering this calculation provides clarity, allowing individuals and organizations to interpret financial data with precision and foresight.
The Core Principle: Understanding Percentage Basics
At its heart, a percentage represents a proportion of a total, expressed as a number out of 100. It’s a universal language for comparisons, making diverse financial figures comprehensible and relatable. When we talk about “percentage total,” we’re often referring to how much a specific component contributes to an overall sum, or how much a value has changed relative to an initial state.

What is a Percentage?
Derived from the Latin “per centum,” meaning “by the hundred,” a percentage is essentially a fraction where the denominator is always 100. For instance, 25% means 25 out of 100, or 25/100. This standardization simplifies comparisons enormously. Imagine trying to compare a company’s profit relative to its revenue if one used fractions like 3/12 and another 7/28; converting both to percentages (25%) makes the comparison immediate and clear.
The Fundamental Formula
The basic formula for calculating a percentage is straightforward:
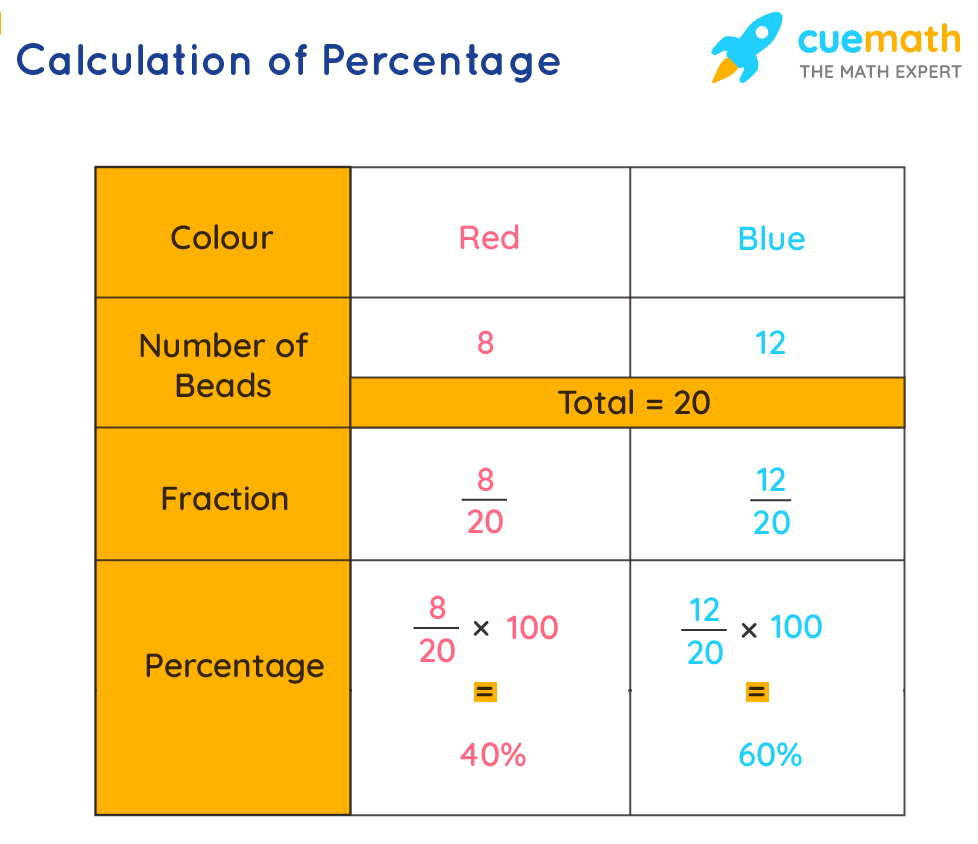
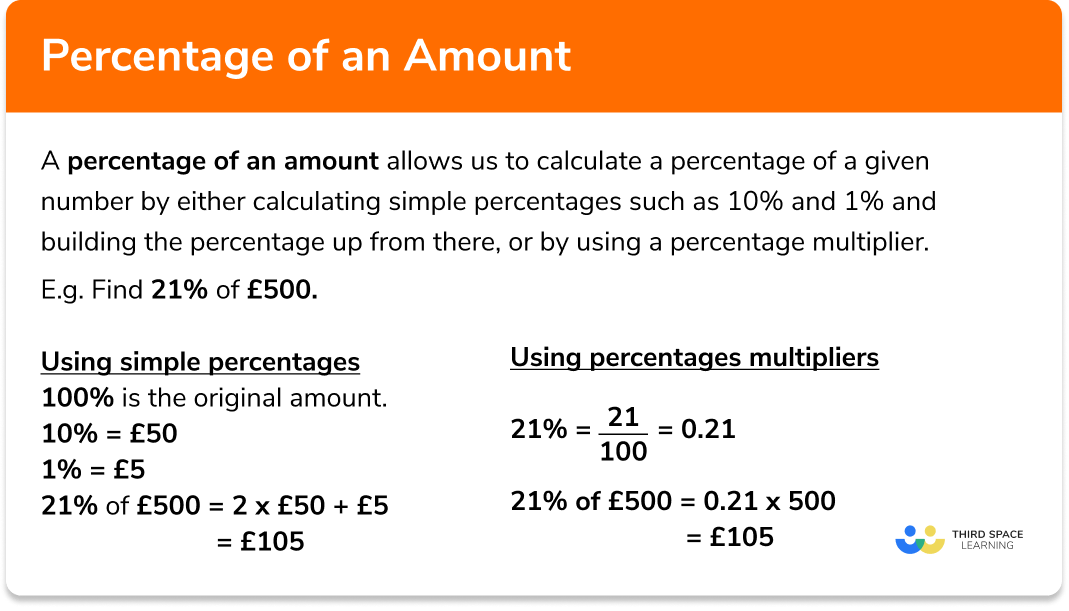
Percentage = (Part / Whole) × 100
Here, “Part” refers to the specific amount or component you are interested in, and “Whole” is the total sum against which the part is being measured. The multiplication by 100 converts the resulting decimal or fraction into a percentage format.
For example, if you earned $3,000 in a month and spent $900 on rent, to find the percentage of your income spent on rent:
Part = $900 (rent)
Whole = $3,000 (income)
Percentage = ($900 / $3,000) × 100 = 0.3 × 100 = 30%
This indicates that 30% of your monthly income goes towards rent.
Another common calculation involves finding the percentage change between two values:
Percentage Change = [(New Value – Old Value) / Old Value] × 100
If your investment grew from $10,000 to $12,000:
New Value = $12,000
Old Value = $10,000
Percentage Change = [($12,000 – $10,000) / $10,000] × 100 = ($2,000 / $10,000) × 100 = 0.2 × 100 = 20%
Your investment saw a 20% increase. A negative result would indicate a percentage decrease.
Why Percentages Matter in Finance
Percentages are indispensable in finance because they provide context and facilitate meaningful comparisons. They allow individuals and businesses to:
-
Benchmark Performance: Compare current figures against historical data, industry averages, or predefined targets.
-
Track Trends: Monitor growth or decline over time (e.g., year-over-year revenue growth).
-
Allocate Resources: Distribute funds or assets based on proportionate needs or strategic objectives.
-
Assess Risk: Understand the relative impact of various factors on financial health.
-
Communicate Clearly: Present complex financial information in an easily understandable format to stakeholders.
Without percentages, financial analysis would be a series of raw numbers, making it incredibly challenging to discern the relative importance or impact of different components.
Practical Applications in Personal Finance
For individuals, percentages are a crucial tool for managing personal finances effectively, enabling informed decisions about spending, saving, and investing.
Budgeting and Expense Allocation
One of the most common applications of percentage totals in personal finance is budgeting. By calculating the percentage of your income allocated to various expense categories, you can gain a clear picture of where your money is going and identify areas for adjustment.
For example, if your net monthly income is $4,000:
-
Rent: $1,200 (30%)
-
Groceries: $600 (15%)
-
Transportation: $400 (10%)
-
Utilities: $200 (5%)
-
Debt Payments: $500 (12.5%)
-
Discretionary Spending: $700 (17.5%)
-
Savings: $400 (10%)
Total: $4,000 (100%)
This breakdown allows you to compare your spending against budgeting rules of thumb (like the 50/30/20 rule) or your personal financial goals. If 30% goes to rent, you might consider it reasonable, but if discretionary spending consistently exceeds 40%, you might see an opportunity to reallocate funds towards savings or debt reduction.
Tracking Savings Goals
Setting and tracking savings goals often involves percentages. You might aim to save 15% of every paycheck or save enough for a down payment that constitutes a certain percentage of a target home price. If you earn $5,000 gross per month and aim to save 10%, you know you need to put $500 aside. Tracking your progress as a percentage of your total goal provides motivation and a clear metric of success.
Understanding Loan Interest Rates
Whether it’s a mortgage, car loan, or credit card, interest rates are expressed as percentages. A 5% annual interest rate on a $20,000 car loan means you will pay $1,000 in interest for the first year if no principal is paid down. Understanding these percentages is vital for comprehending the true cost of borrowing and comparing different loan products. Similarly, calculating the percentage of your monthly payment that goes towards interest versus principal helps illustrate the amortization process.
Investment Portfolio Breakdown
For investors, percentages are indispensable for managing and understanding an investment portfolio. An asset allocation strategy often dictates specific percentages for different asset classes (e.g., 60% stocks, 30% bonds, 10% cash). By calculating the percentage total of each asset in your portfolio, you can ensure it aligns with your desired risk tolerance and financial objectives. For instance, if your initial allocation was 70% stocks and 30% bonds, but due to market performance, stocks now represent 80% of your portfolio, you might choose to rebalance by selling some stocks and buying bonds to restore your target percentages.
Business Finance and Operational Insights
In the business world, percentage totals are even more critical, forming the backbone of financial reporting, performance analysis, and strategic planning. They transform raw accounting data into actionable insights.
Sales Growth and Revenue Share
Businesses constantly track sales growth as a percentage. A “15% year-over-year revenue increase” is a much more impactful and comparable metric than simply stating raw revenue figures. Similarly, understanding market share – the percentage of total sales in an industry that a company captures – is vital for competitive analysis. If a company holds 25% of the market, it signifies its relative position and influence.
Profit Margins
Profitability is consistently evaluated using percentages. Key metrics include:
-
Gross Profit Margin: (Gross Profit / Revenue) × 100. This indicates the percentage of revenue left after deducting the cost of goods sold. A high gross margin suggests efficient production or strong pricing power.
-
Operating Profit Margin: (Operating Income / Revenue) × 100. This shows the percentage of revenue remaining after covering both cost of goods sold and operating expenses, reflecting operational efficiency.
-
Net Profit Margin: (Net Income / Revenue) × 100. This is the ultimate measure of profitability, indicating the percentage of revenue that translates into pure profit after all expenses, including taxes and interest, are paid.
These percentage margins allow businesses to compare their profitability over time, against competitors, and across different product lines.
Cost Analysis and Efficiency
Analyzing costs as percentages of total expenses or revenue helps businesses identify inefficiencies and control spending. For instance, if labor costs represent 45% of total operating expenses, and a competitor’s is 30%, it highlights a potential area for cost reduction or efficiency improvement. Similarly, understanding the percentage of revenue spent on marketing or research and development can inform strategic investment decisions.
Employee Performance Metrics
Percentages are also used in human resources and operations to evaluate performance. Examples include:
-
Sales Target Achievement: The percentage of a sales quota an individual or team has met.
-
Customer Retention Rate: The percentage of customers a business retains over a given period.
-
Defect Rate: The percentage of products that are found to be faulty, crucial for quality control.
These metrics, when expressed as percentages, provide clear benchmarks for performance review and operational improvements.
Advanced Scenarios and Common Pitfalls
While the basic calculation of percentage totals is straightforward, financial analysis often involves nuances that require careful application to avoid misinterpretation.
Percentage Change vs. Percentage Point Change
This distinction is crucial in financial reporting and can often lead to confusion.
-
Percentage Change refers to the relative change between two values. If a company’s profit increased from $100 to $120, that’s a 20% increase ($20/$100 * 100).
-
Percentage Point Change refers to the absolute difference between two percentages. If a company’s market share increased from 10% to 12%, that’s a 2 percentage point increase (12% – 10%). It is not a 2% increase in market share; it’s a 20% increase of the market share (from 10% to 12%). Confusing these two can lead to significant misinterpretations of financial performance.
Calculating Weighted Averages
Sometimes, not all “parts” contribute equally to the “whole.” In these cases, a weighted average is used. For instance, when calculating the average interest rate on a portfolio of loans, you wouldn’t just average the rates; you would weight each rate by the principal amount of the loan.
Weighted Average = Σ (Weight × Value) / Σ Weight
Example: Two loans, $10,000 at 5% and $30,000 at 7%.
Weighted Average Rate = [($10,000 × 0.05) + ($30,000 × 0.07)] / ($10,000 + $30,000)
= ($500 + $2,100) / $40,000 = $2,600 / $40,000 = 0.065 = 6.5%
Avoiding Misinterpretation
The most common pitfall is failing to define the “whole” or the “base” correctly. When presenting a percentage, always ensure the context is clear. For example, stating “costs were reduced by 10%” is less informative than “operating costs were reduced by 10% of last year’s operating costs.” Ambiguity can lead to incorrect conclusions or mislead stakeholders. Furthermore, be wary of small base numbers. A 50% increase from $2 to $3 is numerically less significant than a 5% increase from $1,000,000 to $1,050,000, even though the percentage looks smaller in the latter case.
Tools and Techniques for Calculation
While the underlying principle remains constant, various tools can facilitate calculating percentage totals, catering to different needs and complexities.
Manual Calculation
For simple, one-off calculations, manual computation with a basic calculator is perfectly adequate. As demonstrated earlier, identifying the “part” and the “whole,” then applying the formula (Part / Whole * 100), is straightforward. This method is often preferred for quick estimates or verifying figures.
Spreadsheet Software
For recurring calculations, larger datasets, or complex financial models, spreadsheet software like Microsoft Excel or Google Sheets is indispensable. These tools offer powerful functions that automate percentage calculations.
-
To calculate the percentage of a total: If your “Part” is in cell A2 and your “Whole” is in cell B2, you would enter the formula
= (A2/B2)*100in the desired result cell. You can then format the cell to display as a percentage, which will often automatically handle the multiplication by 100 (e.g.,= A2/B2formatted as percentage would show 30% for 0.3). -
To calculate percentage change: If your Old Value is in A2 and New Value is in B2, the formula would be
= ((B2-A2)/A2)*100. Again, formatting as a percentage can simplify this to= (B2-A2)/A2.
Spreadsheets allow for dynamic calculations, where changing an input value instantly updates all dependent percentage figures, making scenario analysis efficient.
Financial Calculators and Online Tools
Specialized financial calculators, both physical and online, often have dedicated percentage functions that streamline calculations for interest, growth rates, and discounts. Many online financial tools and apps also incorporate percentage calculations to help users track budgets, savings, or investment returns. These can be particularly useful for complex scenarios like calculating compound annual growth rates (CAGR) or specific loan amortization schedules, where the underlying percentage formulas are integrated into the tool’s functionality.
Mastering the calculation of percentage totals is not merely an academic exercise; it’s a practical, essential skill for anyone looking to navigate the complexities of personal finance and the intricacies of business economics. It empowers individuals and organizations to make data-driven decisions, understand financial health, and plan for the future with greater confidence and precision.
aViewFromTheCave is a participant in the Amazon Services LLC Associates Program, an affiliate advertising program designed to provide a means for sites to earn advertising fees by advertising and linking to Amazon.com. Amazon, the Amazon logo, AmazonSupply, and the AmazonSupply logo are trademarks of Amazon.com, Inc. or its affiliates. As an Amazon Associate we earn affiliate commissions from qualifying purchases.