
In the intricate world of finance, numbers tell a story, and percentages often serve as the most compelling narrators. From understanding the discount on a new purchase to deciphering the performance of your investment portfolio, calculating percentages from a total is not just a mathematical exercise; it’s a fundamental skill for making informed financial decisions. Whether you’re managing personal finances, steering a business, or analyzing market trends, a solid grasp of this concept empowers you to interpret data, compare values, and project outcomes with greater clarity.

This article aims to demystify percentage calculations, transforming what might seem like a daunting mathematical task into an accessible and intuitive process. We’ll explore the foundational principles, illustrate their widespread applications across personal, investment, and business finance, and highlight common pitfalls to avoid. By the end, you’ll not only know how to calculate percentages but also why this skill is paramount to mastering your financial destiny.
The Foundational Math: Understanding Percentages
At its core, a percentage is a way to express a number as a fraction of 100. It’s a universal language for representing parts of a whole, offering a standardized method for comparison and proportion that transcends absolute values.
What Exactly is a Percentage?
The term “percent” derives from the Latin “per centum,” meaning “by the hundred” or “for every hundred.” When we say 25%, we mean 25 out of every 100 units of a given total. This standardized representation makes percentages incredibly useful because they provide context. Knowing that a stock price increased by $5 isn’t as informative as knowing it increased by 20% from its original value, especially if you’re comparing it to another stock that increased by $10 but only represented a 5% gain.
Percentages allow us to:
-
Standardize comparisons: Easily compare different-sized quantities.
-
Express proportions: Clearly show what portion one number is of another.
-
Simplify complex data: Make large or fractional numbers more digestible.
The Basic Formula: Part / Total x 100
The calculation of a percentage from a total is remarkably straightforward. It involves three key components: the “part,” the “total” (or “whole”), and the conversion factor of 100.
The formula is:
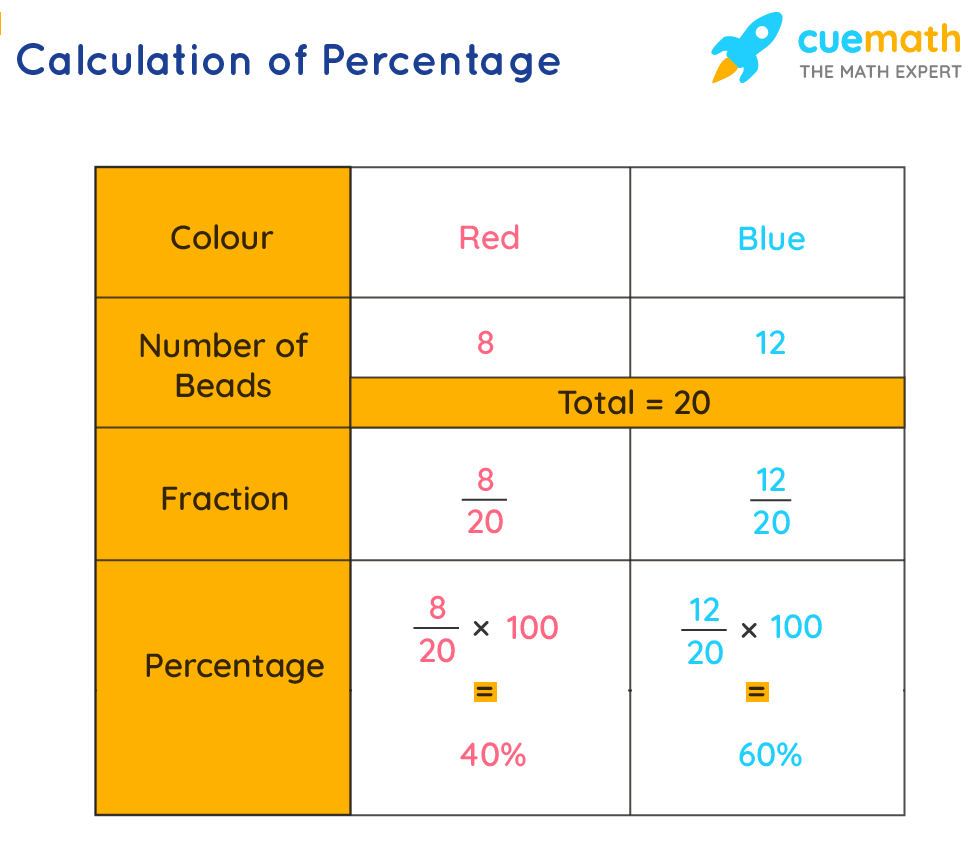
Percentage = (Part / Total) × 100
Let’s break it down with a simple financial example:
Imagine you have a monthly budget of $2,000 (your Total). You spent $500 on groceries (your Part). To find out what percentage of your budget went to groceries:
-
Divide the Part by the Total: $500 / $2,000 = 0.25
-
Multiply by 100: 0.25 × 100 = 25%
So, 25% of your monthly budget was allocated to groceries. This simple calculation allows you to quickly gauge spending habits and adherence to budget goals. The key is always to identify the correct ‘Part’ and the correct ‘Total’ that forms the base for your calculation.
Practical Tools for Calculation
While the formula is simple, various tools can facilitate the calculation, ranging from basic arithmetic to sophisticated software:
-
Mental Math: For simple percentages (e.g., 10%, 25%, 50%), mental estimation can be quick and effective.
-
Basic Calculators: Any standard or smartphone calculator can perform the division and multiplication efficiently.
-
Spreadsheets (Excel, Google Sheets): These are invaluable for financial analysis. You can input your ‘Part’ and ‘Total’ into separate cells, then use a formula like
=(A1/B1)*100to get the percentage. Spreadsheets also allow you to format cells directly as percentages, where you would simply enter=(A1/B1)and then apply the percentage format, which automatically multiplies by 100 and adds the percent symbol. This is particularly useful for tracking multiple financial metrics.
Percentages in Personal Finance: Mastering Your Money
For individuals, understanding percentages is akin to having a financial superpower. It allows for meticulous budgeting, strategic debt management, and effective planning for the future.
Budgeting and Expense Tracking
One of the most common applications of percentages in personal finance is budgeting. Many financial advisors recommend allocating specific percentages of your income to different categories.
-
The 50/30/20 Rule: This popular budgeting guideline suggests allocating 50% of your after-tax income to needs (housing, utilities, groceries), 30% to wants (entertainment, dining out), and 20% to savings and debt repayment. Calculating these percentages from your total income helps you adhere to the rule or adjust it to fit your unique situation. For example, if your monthly take-home pay is $4,000, your needs budget would be $4,000 x 0.50 = $2,000.
-
Analyzing Spending: By tracking your expenses and calculating what percentage each category represents of your total monthly outflow, you can pinpoint areas where you might be overspending. If your dining-out expenses are 20% of your total spending but you aimed for 10%, you’ve identified a clear area for adjustment.
Debt Management and Loan Interest
Percentages are central to understanding and managing debt. Interest rates, often expressed as an Annual Percentage Rate (APR), determine the cost of borrowing money.
-
Understanding APR: If your credit card has an APR of 20%, it means you’ll pay 20% interest annually on your outstanding balance if not paid in full. Calculating the interest portion of your minimum payment requires an understanding of percentages. For a balance of $1,000, 20% APR translates to roughly $1,000 * (0.20/12) = $16.67 in interest per month.
-
Debt-to-Income Ratio (DTI): Lenders use DTI to assess your ability to manage monthly payments and repay debts. It’s calculated by dividing your total monthly debt payments by your gross monthly income, expressed as a percentage. A lower DTI percentage is generally better for securing loans.
Savings and Financial Goals
Achieving financial independence relies heavily on consistent saving, which is often framed in terms of percentages.
-
Savings Rate: A common metric is your savings rate – the percentage of your income that you save. If you earn $5,000 per month and save $1,000, your savings rate is ($1,000 / $5,000) * 100 = 20%. Many financial experts recommend aiming for a savings rate of 15-20% or even higher.
-
Retirement Contributions: Employer-sponsored retirement plans often involve percentage-based contributions. Understanding how an 8% contribution from your salary, possibly matched by an additional 4% from your employer, translates into your total retirement savings is crucial for long-term planning.
Percentages in Investing and Wealth Building
For investors, percentages are the language of performance, risk, and portfolio construction. They enable comparisons, guide decisions, and illuminate the true impact of market movements and fees.
Understanding Investment Returns
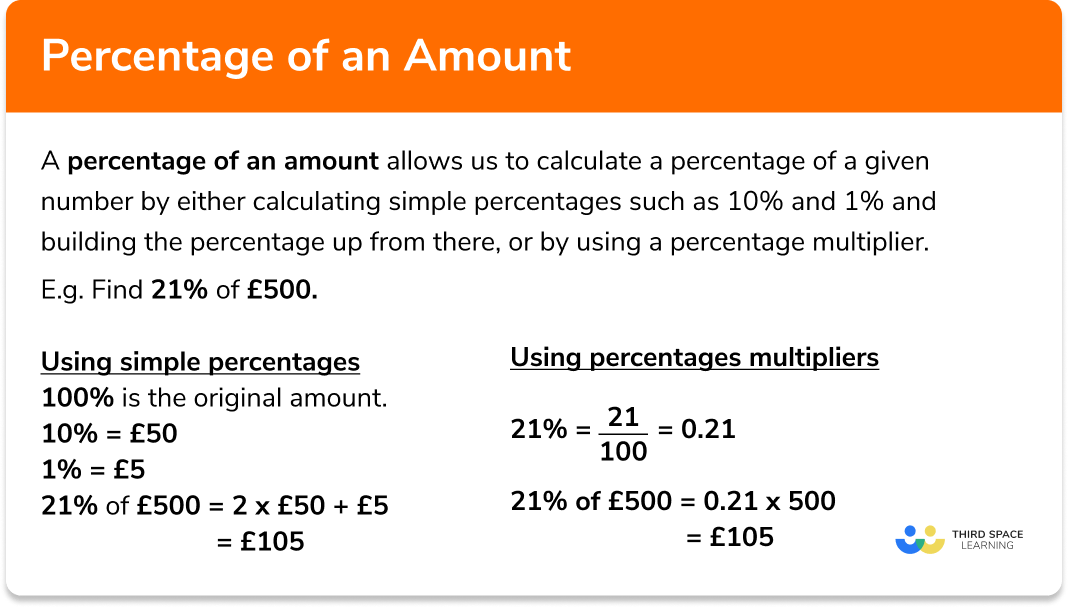
Measuring investment performance is almost exclusively done through percentages.
-
Capital Gains/Losses: If you bought a stock for $100 and sold it for $120, your capital gain is $20. As a percentage, it’s ($20 / $100) * 100 = 20%. This metric helps you compare the profitability of different investments over varying periods.
-
Annualized Returns: Investment funds often report annualized returns, which express the percentage return over a year. When comparing two mutual funds, one with a 10% annual return and another with 8%, the percentage clearly indicates which performed better relative to its initial value.
-
Dividend Yield: For income-generating investments like stocks or bonds, dividend yield is the annual dividend per share divided by the share price, expressed as a percentage. This helps investors assess the income potential relative to the investment’s cost.
Portfolio Allocation and Diversification
Strategic asset allocation, a cornerstone of successful investing, is entirely percentage-based.
-
Asset Classes: A diversified portfolio might target 60% in stocks, 30% in bonds, and 10% in real estate. Calculating the current percentage of each asset in your portfolio allows you to “rebalance” — adjusting your holdings to bring them back to your target percentages when market fluctuations cause them to drift. For example, if stocks outperform and now represent 70% of your portfolio, you might sell some stocks and buy more bonds to restore your 60/30/10 balance.
-
Risk Management: Understanding the percentage allocation to different asset classes helps manage risk. A higher percentage in volatile assets like stocks might indicate a higher risk tolerance, while a larger percentage in stable assets like bonds suggests a more conservative approach.
Fees and Their Impact
Investment fees, often seemingly small percentages, can significantly erode long-term returns.
-
Expense Ratios: Mutual funds and ETFs charge an annual expense ratio, expressed as a percentage of your total investment. An expense ratio of 0.50% on a $100,000 investment means $500 in fees annually. Over decades, even a difference of 0.25% in expense ratios can amount to tens of thousands of dollars in lost gains due to compounding.
-
Transaction Fees: Some brokers charge a percentage of the trade value for buying or selling securities. Understanding these percentages helps calculate the true cost of trading.
Percentages in Business Finance and Entrepreneurship
For businesses, percentages are vital for measuring performance, setting prices, analyzing market position, and making strategic decisions. They provide insights into profitability, efficiency, and growth.
Profitability Metrics
Businesses rely on various percentage-based metrics to gauge their financial health.
-
Gross Profit Margin: This measures the percentage of revenue left after deducting the cost of goods sold (COGS). Formula:
(Revenue - COGS) / Revenue * 100. A higher gross profit margin indicates more efficient production or strong pricing power. -
Net Profit Margin: This is the percentage of revenue left after all expenses, including taxes, have been deducted. Formula:
Net Income / Revenue * 100. It’s a key indicator of overall profitability and operational efficiency. -
Operating Margin: Measures the percentage of revenue remaining after operating expenses (like salaries and rent) are subtracted, but before interest and taxes. This shows how efficiently a company is generating profit from its core operations.
Discounts, Markups, and Sales Tax
Pricing strategies, sales, and tax calculations are heavily dependent on percentages.
-
Discounts: Offering a 15% discount on a product priced at $100 means the customer saves $15. Understanding how to calculate these percentages is crucial for both retailers and consumers.
-
Markups: Businesses calculate markups (the percentage added to the cost to determine the selling price) to ensure profitability. If an item costs $50 to produce and you want a 40% markup, you’d sell it for $50 + ($50 * 0.40) = $70.
-
Sales Tax: Sales tax is a percentage applied to the selling price of goods and services. Knowing how to calculate it is essential for businesses to remit the correct amount to tax authorities and for consumers to understand the final cost of their purchases.
Market Share and Growth Rates
Businesses use percentages to assess their position in the market and track their expansion.
-
Market Share: Calculated as
(Company Sales / Total Market Sales) * 100, market share indicates a company’s slice of the overall market pie. A growing market share percentage signifies increasing competitiveness and reach. -
Year-over-Year Growth: This measures the percentage increase or decrease in a financial metric (like revenue or profit) compared to the same period in the previous year. It’s a critical indicator of a company’s growth trajectory and health.
-
Customer Retention Rate: The percentage of customers a business retains over a period. A high retention rate suggests customer satisfaction and loyalty, which are crucial for sustainable growth.
Common Pitfalls and Advanced Considerations
While the basic formula for calculating percentages from a total is straightforward, some nuances and advanced applications can trip up even experienced individuals.
Confusing the Base (The ‘Total’)
The most frequent error in percentage calculations is misidentifying the ‘total’ or ‘base’ number.
-
Percentage Increase vs. Percentage of New Total: If an item’s price increases from $100 to $120, the percentage increase is ($20 / $100) * 100 = 20%. However, the new price of $120 is 120% of the original total. Be clear about what the ‘total’ refers to.
-
Example in Finance: When calculating a percentage decrease in a stock price, the ‘total’ should be the original higher price, not the lower price after the drop. If a stock drops from $100 to $80, the decrease is ($20 / $100) * 100 = 20%.
The Power of Percentage Points vs. Percentages
It’s crucial to distinguish between a change in “percentage points” and a “percentage change.”
-
If an interest rate rises from 5% to 6%, it’s a 1 percentage point increase.
-
However, it’s a (1% / 5%) * 100 = 20% relative increase in the interest rate itself.
This distinction is vital for accurately interpreting financial news, economic reports, and policy changes, where a small percentage point change can represent a significant relative shift.
Beyond Simple Calculations: Weighted Averages and CAGR
While this article focuses on basic percentage calculations, it’s worth noting that they form the building blocks for more complex financial metrics:
-
Weighted Averages: Used in portfolio performance, where each asset’s return is weighted by its percentage allocation in the portfolio.
-
Compound Annual Growth Rate (CAGR): A more sophisticated measure of investment return that smooths out year-to-year volatility, essentially calculating the average annual percentage growth over a specified period.
Understanding the simple “part / total x 100” formula provides the essential foundation for grasping these more advanced concepts and applying them effectively in your financial journey.
Conclusion
Calculating percentages from a total is far more than a mere mathematical operation; it’s a critical competency for navigating the complexities of the financial world. From managing your daily budget and optimizing your investment portfolio to evaluating business performance and understanding economic trends, percentages provide the clarity and context needed to make informed and strategic decisions.
By mastering the foundational formula, recognizing its myriad applications in personal, investment, and business finance, and being mindful of common pitfalls, you equip yourself with an invaluable tool. Embrace the power of percentages – they are the universal language that empowers you to decode financial data, assess opportunities, mitigate risks, and ultimately, build a more secure and prosperous financial future. Start applying these calculations in your daily financial life, and watch as your understanding and control over your money grow exponentially.
aViewFromTheCave is a participant in the Amazon Services LLC Associates Program, an affiliate advertising program designed to provide a means for sites to earn advertising fees by advertising and linking to Amazon.com. Amazon, the Amazon logo, AmazonSupply, and the AmazonSupply logo are trademarks of Amazon.com, Inc. or its affiliates. As an Amazon Associate we earn affiliate commissions from qualifying purchases.