
Understanding percentages is not just a mathematical skill; it’s a critical life skill, especially in the realm of finance. From deciphering interest rates on a loan to calculating your investment returns, or even just understanding a sale discount, percentages are the language of money. They provide a standardized way to compare parts to a whole, to express change, and to make informed financial decisions. In an increasingly data-driven world, where financial literacy is paramount, mastering how to calculate and interpret percentages empowers individuals and businesses alike to navigate economic landscapes with confidence. This guide will demystify percentages, focusing on their crucial role and practical application in personal and business finance.

The Core Concept: What is a Percentage?
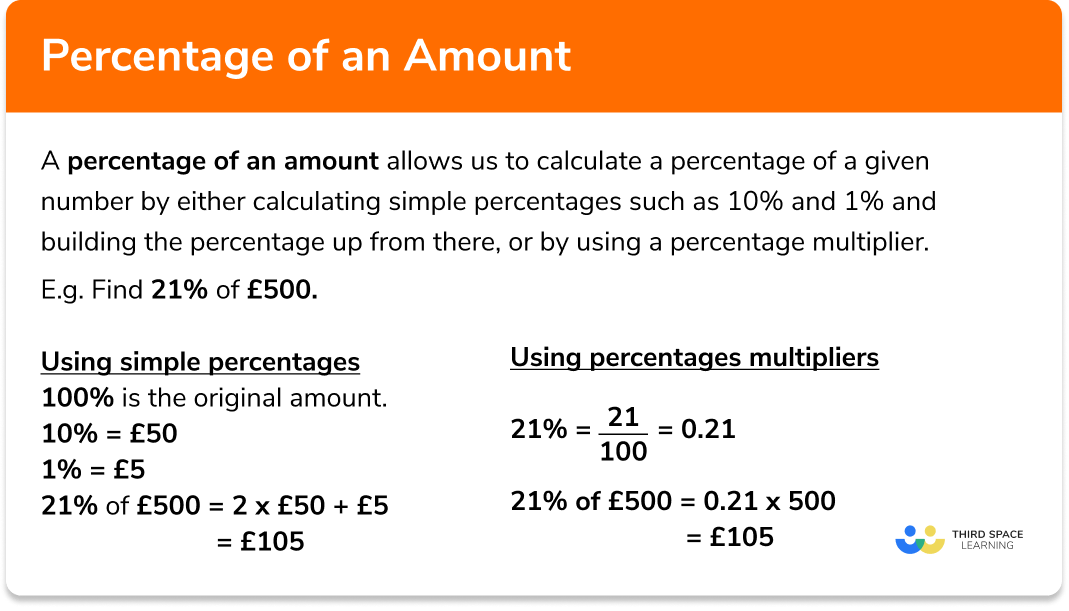
At its heart, a percentage is a fraction out of 100. The word “percent” literally means “per one hundred.” It’s a way of expressing a number or a ratio as a fraction of 100. This standardization makes it incredibly useful for comparisons, as it normalizes quantities to a common base. Whether you’re comparing a small part of a large whole or a large part of a small whole, expressing it as a percentage allows for an immediate understanding of its proportional significance.
Understanding the Basics: Part, Whole, and Rate
The fundamental formula for calculating a percentage is straightforward:
Percentage = (Part / Whole) * 100
Let’s break down these components:
-
The Part: This is the specific amount or quantity you are interested in expressing as a percentage. It’s the numerator in the underlying fraction.
-
The Whole: This is the total amount, the baseline, or the original value against which the part is being compared. It’s the denominator in the underlying fraction.
-
100: This multiplier converts the decimal or fractional ratio into a percentage.
Example: If you spend $300 on groceries from a monthly income of $3,000, your grocery expense is:
($300 / $3,000) * 100 = 0.10 * 100 = 10%.
Here, $300 is the ‘part’, $3,000 is the ‘whole’, and 10% is the ‘percentage rate’.
Why Percentages Matter in Finance
Percentages are indispensable in finance because they offer a universal metric for comparison and evaluation, transcending absolute dollar figures which can be misleading without context. For instance, knowing a company’s profit is $1 million doesn’t tell you much until you compare it to its revenue (e.g., $1 million profit on $10 million revenue is a 10% profit margin, which is significant, versus $1 million profit on $100 million revenue, which is only 1%). Percentages enable:
-
Standardized Comparison: Allows for easy comparison of different financial entities or periods, regardless of their absolute scale.
-
Performance Measurement: Key to assessing growth, decline, efficiency, and profitability.
-
Risk Assessment: Used to quantify exposure, probability of default, or volatility.
-
Decision Making: Facilitates choices in budgeting, investing, borrowing, and pricing.
Without a solid grasp of percentage calculations, individuals and businesses are effectively operating in the dark, unable to accurately assess financial health, opportunities, or risks.
Practical Applications of Percentages in Personal Finance
In personal finance, percentages are woven into the fabric of everyday decisions, from managing a household budget to planning for retirement. Understanding how to apply them directly impacts your financial well-being.
Budgeting and Expense Tracking
Budgeting is fundamentally an exercise in percentage allocation. A common budgeting rule, like the 50/30/20 rule, is entirely based on percentages: 50% of income for needs, 30% for wants, and 20% for savings and debt repayment. To apply this, you need to calculate:
-
Percentage of Income Spent on a Category: (Category Expense / Total Monthly Income) * 100. This helps identify where your money is going and whether you’re overspending in certain areas.
-
Debt-to-Income Ratio (DTI): (Total Monthly Debt Payments / Gross Monthly Income) * 100. Lenders use DTI to assess your ability to manage monthly payments and repay debts. A high DTI can hinder your ability to get new loans or mortgages.
Savings and Investments
Percentages are at the core of wealth creation and accumulation:
-
Compound Interest: The magic of compound interest, where your interest earns interest, is calculated using percentages. If you invest $1,000 at a 5% annual interest rate, you don’t just earn $50 per year; in year two, you earn 5% on $1,050, and so on. Understanding this growth allows you to project future values of your savings.
-
Return on Investment (ROI): (Net Profit from Investment / Cost of Investment) * 100. ROI is a critical metric for evaluating the profitability of an investment. A 10% ROI means you’ve gained 10 cents for every dollar invested.
-
Growth Rates: Whether it’s your retirement portfolio growing by 7% annually or a specific stock increasing by 20% in a quarter, these percentage figures communicate performance concisely.
Debt Management
Managing debt effectively requires a firm grasp of percentages:
-
Interest Rates: The most obvious application. A credit card with an 18% APR means you pay 18% of your outstanding balance annually in interest. Understanding how these percentages translate to dollar amounts is crucial for minimizing interest paid and accelerating debt payoff.
-
Minimum Payments: Often expressed as a percentage of your outstanding balance, plus interest. Knowing this helps you see how little progress you make by only paying the minimum.
Discounts, Sales, and Taxes
Everyday consumer finance is riddled with percentages:
-
Discounts: A “20% off” sale means you subtract 20% of the original price. To calculate the discount amount: (Original Price * Discount Percentage / 100). To find the new price: Original Price – Discount Amount.
-
Sales Tax: Added to the price of goods. If sales tax is 8%, you calculate (Item Price * 8 / 100) and add it to the item price to find the total cost.
-
Tips: Often calculated as 15-20% of the bill, understanding this helps ensure fair compensation.
Leveraging Percentages in Business and Entrepreneurship
For businesses, large or small, percentages are vital for measuring performance, making strategic decisions, and ensuring profitability and sustainability. They provide the lens through which financial health and operational efficiency are assessed.
Profit Margins and Markups
These are fundamental to pricing and profitability:
-
Gross Profit Margin: ((Revenue – Cost of Goods Sold) / Revenue) * 100. This tells a business how much profit it makes from each sale after accounting for direct costs. A 30% gross margin means 30 cents of every dollar of revenue is available to cover operating expenses and net profit.
-
Net Profit Margin: (Net Profit / Revenue) * 100. This is the ultimate measure of a company’s profitability, showing how much profit is generated for every dollar of revenue after all expenses, including taxes, are accounted for.
-
Markup: The percentage added to a product’s cost to arrive at its selling price. If an item costs $50 and sells for $75, the markup is (($75 – $50) / $50) * 100 = 50%.
Sales Growth and Market Share Analysis
Businesses track their growth and competitive position using percentages:
-
Sales Growth Percentage: ((Current Period Sales – Previous Period Sales) / Previous Period Sales) * 100. Essential for evaluating a company’s expansion or contraction over time.
-
Market Share: (Company’s Sales / Total Market Sales) * 100. Indicates a company’s proportion of the total sales in its industry. A growing market share suggests increasing competitive strength.
Financial Ratios
Many critical financial ratios that investors and analysts use are expressed as percentages:
-
Operating Expense Ratio: (Operating Expenses / Revenue) * 100. Measures operational efficiency.
-
Return on Equity (ROE): (Net Income / Shareholder Equity) * 100. Shows how much profit a company generates for each dollar of shareholder equity, indicating efficiency in using investor funds.
-
Current Ratio: Although often expressed as a decimal, its components are directly related to liquidity percentages. A common quick ratio is often expressed as a decimal, but if you look at the components (e.g., current assets as a percentage of current liabilities), you’re dealing with proportional analysis.
Pricing Strategies and Discounts
Strategic pricing often involves percentages:
-
Volume Discounts: Offering 10% off for purchases over a certain amount.
-
Trade Discounts: Percentages off the list price offered to distributors or retailers.
-
Promotional Pricing: Understanding how percentage discounts affect profit margins is crucial to avoid selling at a loss.
Advanced Percentage Concepts and Financial Tools
While the basic percentage formula is simple, its applications can become sophisticated, requiring a deeper understanding and the use of appropriate tools.
Understanding Percentage Change
Beyond simply finding a part of a whole, percentages are frequently used to express change over time or between two different values.
Percentage Change = ((New Value – Old Value) / Old Value) * 100
-
Inflation/Deflation: The percentage change in the general price level of goods and services. Understanding this helps assess the real value of money over time.
-
Stock Market Swings: A stock rising by 5% or falling by 2% communicates its daily volatility.
-
Year-over-Year (YoY) Growth: Companies often report YoY percentage changes in revenue, profit, etc., to smooth out seasonal fluctuations.
Compound Annual Growth Rate (CAGR) and Its Significance
CAGR is a useful metric for smoothing out volatile annual growth rates over multiple periods to provide a more representative average growth rate. It assumes that the investment was compounded over the specified time period.
CAGR = [ (Ending Value / Beginning Value)^(1 / Number of Years) – 1 ] * 100
This is particularly relevant for analyzing long-term investment performance, comparing the growth of different investments, or assessing business growth over several years, giving a more accurate picture than a simple average of annual percentage changes.
Using Spreadsheets and Financial Calculators
While mental math or a basic calculator suffices for simple percentages, complex financial calculations involving percentages benefit immensely from dedicated tools:
-
Spreadsheets (Excel, Google Sheets): Invaluable for budgeting, financial modeling, and investment analysis. They handle percentage calculations with ease, automatically updating figures as inputs change. Functions like
RATE,PV,FV, andPMT(for interest and loan calculations) often output or require percentage inputs. -
Financial Calculators: Specialized calculators (physical or app-based) are designed for complex time-value-of-money problems, allowing you to input variables like interest rates (percentages), number of periods, and payment amounts to solve for future or present values.
-
Online Tools and Apps: Many personal finance apps and websites include built-in calculators for loans, mortgages, retirement savings, and investment returns, all heavily reliant on percentage calculations.
The Pitfalls of Percentage Misinterpretation
While powerful, percentages can be misleading if not interpreted carefully:
-
Base Rate Fallacy: Ignoring the actual underlying numbers or the context from which a percentage is derived. A “100% increase” from $1 to $2 is less significant than a “10% increase” from $1 million to $1.1 million.
-
Nominal vs. Real Rates: An 8% investment return (nominal) might feel good, but if inflation is 5%, your real return is only 3%. Always consider the impact of inflation when evaluating percentage returns.
-
Percentage Points vs. Percentages: An increase from 5% to 6% is a 1 percentage point increase, but it’s a ( (6-5)/5 ) * 100 = 20% percentage increase. This distinction is crucial in financial reporting.
-
Misleading Comparisons: Comparing percentages of different bases can create a false impression. For example, a company with a 50% profit margin on $100,000 revenue is less profitable than a company with a 10% profit margin on $5 million revenue.

Conclusion
The ability to calculate and understand percentages is more than just academic; it is a foundational pillar of financial literacy. From personal budgeting and investment planning to strategic business decisions and market analysis, percentages provide the indispensable framework for comparing, evaluating, and projecting financial outcomes. By mastering the simple formula of part over whole multiplied by 100, and by understanding its diverse applications and potential pitfalls, you gain a powerful tool for navigating the complexities of the financial world. Embracing this fundamental concept not only clarifies your current financial position but also empowers you to make smarter, more informed decisions that pave the way for greater financial security and success.
aViewFromTheCave is a participant in the Amazon Services LLC Associates Program, an affiliate advertising program designed to provide a means for sites to earn advertising fees by advertising and linking to Amazon.com. Amazon, the Amazon logo, AmazonSupply, and the AmazonSupply logo are trademarks of Amazon.com, Inc. or its affiliates. As an Amazon Associate we earn affiliate commissions from qualifying purchases.