
In the complex world of finance, investors are constantly seeking metrics that can objectively measure the true skill of a portfolio manager or the intrinsic value added by an investment strategy. Among the myriad of financial ratios and indicators, “alpha” stands out as a paramount measure, offering a direct assessment of an investment’s performance relative to what would be expected given its level of market risk. Understanding and calculating alpha is fundamental for anyone looking to move beyond mere market returns and truly identify value-generating investments. It’s the metric that helps differentiate between luck and genuine skill in investment management, making it an indispensable tool for both professional fund managers and savvy individual investors.

Understanding Alpha: The Quest for Outperformance
Alpha, often referred to as “Jensen’s alpha” or the “excess return,” represents the portion of a portfolio’s return that cannot be attributed to the overall market’s movement or the portfolio’s systematic risk. In simpler terms, it’s the return an investment achieves above the return predicted by the capital asset pricing model (CAPM), given the investment’s beta (a measure of market risk). A positive alpha indicates that the investment strategy or manager has outperformed the market or benchmark after adjusting for risk, while a negative alpha suggests underperformance.
What is Alpha in Finance?
Alpha is a key concept in active investment management. While passive investing aims to replicate market returns by tracking an index, active management strives to beat the market. Alpha quantifies the success of these active strategies. It isolates the returns generated by a manager’s specific decisions, such as stock selection, market timing, or asset allocation, from the returns that would have been achieved simply by holding a diversified market portfolio with similar risk characteristics. For example, if a fund manager takes on more risk (higher beta) and achieves higher returns, a significant portion of those returns might simply be compensation for that higher risk. Alpha helps strip away this risk-adjusted return, revealing the pure value added (or subtracted) by the manager’s talent.
Why Alpha Matters to Investors
Alpha holds immense significance for investors because it serves as a critical indicator of managerial skill and the effectiveness of an investment strategy. For institutional investors and high-net-worth individuals, a consistent positive alpha from a fund manager justifies the management fees charged, as it demonstrates that the manager is adding value beyond what a low-cost index fund could provide. For individual investors, understanding alpha helps in evaluating mutual funds, exchange-traded funds (ETFs), and even their own self-managed portfolios. It shifts the focus from just absolute returns to risk-adjusted returns, which is a more robust way to gauge investment success. A high return with a low alpha might just mean the investor took on excessive, uncompensated risk, whereas a moderate return with a strong positive alpha might indicate superior stock picking or risk management.
Alpha vs. Beta: A Crucial Distinction
To fully grasp alpha, it’s essential to differentiate it from beta. Beta (β) measures an investment’s sensitivity to market movements, or its systematic risk. A beta of 1 means the investment’s price tends to move with the market. A beta greater than 1 suggests it’s more volatile than the market (e.g., a high-growth tech stock), while a beta less than 1 indicates less volatility (e.g., a utility stock). Beta accounts for the expected return of an investment based on its market risk exposure.
Alpha, on the other hand, is the unexplained portion of the return—the return achieved above or below what beta would predict. Beta is about correlation and systematic risk, while alpha is about idiosyncratic return generation or skill. An investment with a high beta might generate high returns in a bull market, but that’s expected due to its market exposure. Alpha seeks to uncover whether the investment performed better than its beta would suggest, indicating genuine outperformance not simply attributable to riding the market wave.
The Formula Behind Alpha: Quantifying Skill
Calculating alpha involves leveraging the Capital Asset Pricing Model (CAPM) to determine the expected return of an investment and then comparing that to the actual return. The result reveals whether the investment delivered more or less than what its risk profile predicted.
The Basic Alpha Equation
The most common way to calculate alpha is using the following formula, derived from the CAPM:
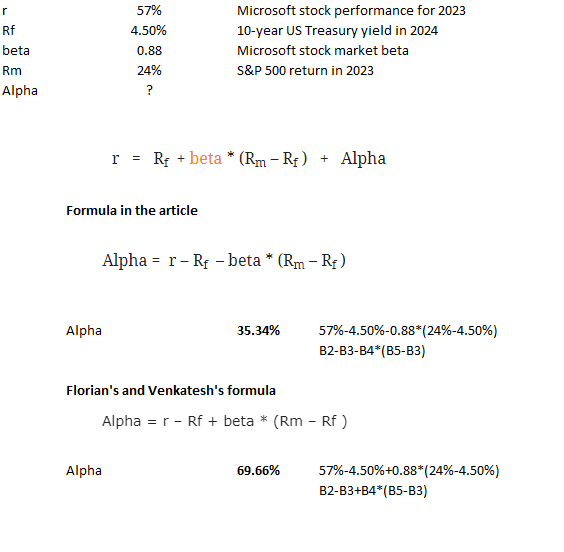
Alpha = Rp – [Rf + βp * (Rm – R_f)]
Where:
-
R_p = The realized return of the portfolio or investment
-
R_f = The risk-free rate of return (e.g., the yield on a U.S. Treasury bill)
-
β_p = The beta of the portfolio or investment (its sensitivity to market movements)
-
R_m = The realized return of the market benchmark (e.g., S&P 500)
-
(Rm – Rf) = The market risk premium (the excess return expected from the market over the risk-free rate)
Breaking Down the Components
Each component of the alpha formula plays a crucial role in isolating the true value added by an investment:
-
Realized Portfolio Return (R_p): This is the actual total return generated by the investment over a specific period (e.g., monthly, quarterly, annually). It includes capital appreciation and any income received (dividends, interest). Accurate calculation of this return is paramount.
-
Risk-Free Rate (R_f): This represents the theoretical return an investor could expect from an investment with zero risk. Typically, the yield on short-term government securities (like U.S. Treasury bills) is used as a proxy. It accounts for the time value of money, as investors should expect at least this return for simply delaying consumption.
-
Market Return (R_m): This is the actual return of a broad market index that serves as a benchmark for the investment. For instance, if you’re analyzing a U.S. equity portfolio, the S&P 500 is a common benchmark. The choice of benchmark is critical and should reflect the investment’s strategy and asset class.
-
Beta of the Portfolio (β_p): As discussed, beta measures the investment’s volatility relative to its benchmark. It’s usually calculated through regression analysis of the portfolio’s historical returns against the benchmark’s returns. A beta of 1.2 suggests the portfolio is 20% more volatile than the market, while a beta of 0.8 means it’s 20% less volatile.
The term [Rf + βp * (Rm – Rf)] in the equation represents the expected return of the portfolio according to CAPM. This is the return that would be justified purely by the investment’s market risk exposure and the general market conditions. Alpha then tells us how much the actual return (R_p) deviated from this expected return.
Step-by-Step Calculation Example
Let’s walk through a simple example:
Assume we are evaluating an investment portfolio over the last year with the following data:
-
Realized Portfolio Return (R_p) = 15% (or 0.15)
-
Risk-Free Rate (R_f) = 2% (or 0.02)
-
Market Return (R_m) = 10% (or 0.10)
-
Beta of the Portfolio (β_p) = 1.2
Step 1: Calculate the Market Risk Premium.
Market Risk Premium = Rm – Rf
Market Risk Premium = 0.10 – 0.02 = 0.08 (or 8%)
Step 2: Calculate the Expected Return of the Portfolio (using CAPM).
Expected Return = Rf + βp * (Rm – Rf)
Expected Return = 0.02 + 1.2 * (0.08)
Expected Return = 0.02 + 0.096
Expected Return = 0.116 (or 11.6%)
Step 3: Calculate Alpha.
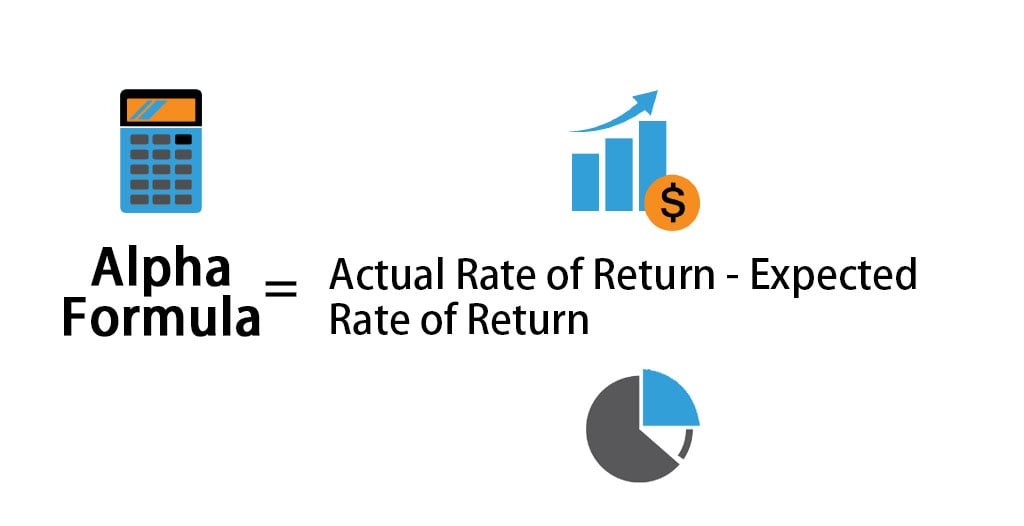
Alpha = R_p – Expected Return
Alpha = 0.15 – 0.116
Alpha = 0.034 (or 3.4%)
In this example, the portfolio generated an alpha of 3.4%. This means that the portfolio manager added 3.4% of value above what would have been expected given the market’s performance and the portfolio’s level of systematic risk. This positive alpha indicates superior performance.
Practical Applications and Interpretation of Alpha
Once calculated, alpha isn’t just a number; it’s a powerful interpretative tool that guides investment decisions and evaluations. Its implications vary significantly depending on whether it’s positive, negative, or zero.
Positive, Negative, and Zero Alpha
-
Positive Alpha (Alpha > 0): This is the holy grail for active managers. A positive alpha signifies that the investment or portfolio has outperformed its benchmark after accounting for the risk taken. It suggests that the manager’s stock selection, asset allocation, or market timing decisions were successful in generating excess returns. For investors, a consistently positive alpha is a strong indicator of a skilled manager or a robust investment strategy.
-
Negative Alpha (Alpha < 0): A negative alpha indicates underperformance relative to the benchmark, even after adjusting for risk. This means the investment strategy or manager failed to generate the returns expected given its market risk exposure. In such cases, investors might have been better off simply investing in a passive index fund with similar risk characteristics, especially considering the fees associated with active management. Consistent negative alpha is a red flag and often leads to fund closures or manager changes.
-
Zero Alpha (Alpha = 0): A zero alpha suggests that the investment performed exactly as expected given its market risk. The returns generated were perfectly explained by its beta and the overall market movements. In this scenario, the active manager did not add any discernible value above what a passive, low-cost index fund with similar risk could have achieved. For a fee-charging active fund, zero alpha implies that the fees were essentially wasted.
Alpha in Portfolio Management
For professional portfolio managers, alpha is the ultimate scorecard. It’s what they strive to achieve and what justifies their existence (and their fees). Many funds explicitly state their goal is to generate alpha. For example, a hedge fund might aim to generate absolute returns regardless of market direction, or a long-only equity fund might aim to beat the S&P 500 by a certain percentage after risk adjustment. Managers use alpha to:
-
Assess their own performance: Internally, it helps them understand which strategies or individual stock picks contributed most to (or detracted from) overall performance.
-
Communicate value to clients: A strong positive alpha provides a compelling narrative for attracting and retaining investors.
-
Refine investment processes: By analyzing periods of high or low alpha, managers can identify strengths and weaknesses in their approach.
Using Alpha to Evaluate Investment Opportunities
Individual investors can utilize alpha to make more informed decisions about where to allocate their capital:
-
Fund Selection: When comparing mutual funds or ETFs, don’t just look at total returns. A fund with slightly lower absolute returns but a higher alpha might be preferable to one with higher absolute returns but a lower (or negative) alpha, as it suggests more efficient risk-taking.
-
Benchmarking Personal Portfolios: Even if you manage your own investments, calculating your portfolio’s alpha can provide a reality check. Are your active decisions truly adding value, or are you just riding market waves or taking on uncompensated risk?
-
Active vs. Passive Debate: Alpha is central to the active vs. passive investing debate. If few active managers consistently generate positive alpha net of fees, it strengthens the argument for low-cost passive index funds. However, identifying the rare managers who do generate consistent alpha can lead to significant outperformance.
Beyond the Numbers: Nuances and Limitations of Alpha
While alpha is an incredibly valuable metric, it’s not without its complexities and limitations. A superficial understanding can lead to misinterpretations; therefore, a deeper appreciation of its nuances is essential for any serious investor.
Data Dependency and Accuracy Challenges
The calculation of alpha is highly dependent on the quality and representativeness of the input data.
-
Lookback Period: The period over which returns and beta are calculated significantly impacts alpha. A short lookback period might be skewed by recent market anomalies, while a very long one might smooth out important recent trends. There’s no single “correct” lookback period, and investors must be mindful of how it affects the results.
-
Historical Data vs. Future Performance: Alpha is a backward-looking measure. A high alpha in the past is no guarantee of future outperformance. Markets evolve, manager strategies can shift, and past conditions may not repeat.
-
Benchmark Selection: Choosing the appropriate market benchmark (R_m) is crucial. A poorly chosen benchmark can distort alpha. For instance, evaluating an emerging markets fund against the S&P 500 would yield a misleading alpha. The benchmark must accurately reflect the investment universe and risk profile of the portfolio.
The Impact of Risk Adjustment
Alpha’s effectiveness hinges on the accuracy of its risk adjustment, primarily through beta.
-
Beta’s Limitations: Beta, as a measure of systematic risk, assumes a linear relationship between an investment and the market, and it doesn’t always capture all forms of risk. For example, it doesn’t account for tail risk, liquidity risk, or credit risk. For portfolios with complex strategies or illiquid assets, beta alone might be an insufficient measure of total risk.
-
Multi-Factor Models: In response to beta’s limitations, more sophisticated multi-factor models (e.g., Fama-French three-factor model, Carhart four-factor model) have emerged. These models include additional factors beyond market risk, such as size, value, and momentum, to explain returns. While more complex, they can potentially provide a more refined “alpha” that is truly unexplained by a broader set of risk factors. However, the basic CAPM alpha remains widely used due to its simplicity and intuitive appeal.
Alpha is Not a Guarantee
Even a consistently high positive alpha over several years does not guarantee future success.
-
Market Efficiency: The theory of efficient markets suggests that consistently generating alpha is extremely difficult because all publicly available information is already reflected in asset prices. If this holds true, any observed alpha might be more a result of luck or temporary market inefficiencies rather than sustainable skill.
-
Survivorship Bias: When evaluating funds, it’s important to consider survivorship bias. Funds with poor performance and negative alpha often get liquidated, leaving only the “winners” in the historical dataset. This can inflate the perceived average alpha of active funds.
-
Risk-Taking: Sometimes, high alpha can be a result of managers taking on unobservable or uncompensated risks that are not fully captured by beta. While these might pay off in the short term, they could lead to significant drawdowns during adverse market conditions.
Considerations for Different Asset Classes
Alpha calculation and interpretation can vary depending on the asset class.
-
Equities vs. Fixed Income: While typically applied to equities, alpha can also be calculated for fixed income portfolios. However, defining the “market” and “beta” for fixed income can be more complex due to the diverse nature of bonds (credit risk, interest rate sensitivity, duration).
-
Alternative Investments: For alternative investments like hedge funds or private equity, traditional beta might not be as relevant due to their unique strategies, illiquidity, and less direct correlation with broad market indexes. Sophisticated models often incorporate specific risk factors pertinent to these asset classes to calculate a more meaningful alpha.
Integrating Alpha into Your Investment Strategy
Armed with a comprehensive understanding of alpha, investors can effectively integrate this powerful metric into their broader investment strategy, using it as a cornerstone for evaluating performance and making judicious allocation decisions.
Combining Alpha with Other Metrics
Alpha rarely tells the whole story on its own. It is most effective when analyzed in conjunction with other key financial ratios to gain a holistic view of an investment’s quality.
-
Sharpe Ratio: Measures risk-adjusted return by dividing the excess return (over the risk-free rate) by the standard deviation of returns (total risk). A high Sharpe Ratio indicates good returns for the level of risk taken. While alpha focuses on uncompensated risk-adjusted return relative to beta, the Sharpe Ratio considers total risk.
-
Sortino Ratio: Similar to the Sharpe Ratio, but it focuses only on downside deviation (bad volatility) in the denominator, making it particularly useful for investors concerned about losses.
-
Standard Deviation: Measures the total volatility or dispersion of returns around the average. While not a risk-adjusted metric itself, it provides context for alpha; a high alpha achieved with extremely high standard deviation might be less appealing than a slightly lower alpha with much less volatility.
-
R-squared (R²): Indicates the percentage of a portfolio’s movement that can be explained by the movements of its benchmark. A high R² (e.g., 0.80 or higher) suggests that beta is a good predictor of the portfolio’s returns, making alpha a more reliable measure. A low R² means beta might not be a good fit, and thus, the calculated alpha might be less meaningful.
By cross-referencing alpha with these metrics, investors can discern whether a positive alpha is a result of genuinely skilled management, or if it merely reflects excessive total risk, or if the beta itself is a poor fit for the portfolio.
Active vs. Passive Investing Revisited
Alpha is at the heart of the ongoing debate between active and passive investing.
-
The Passive Argument: Proponents of passive investing often argue that consistently generating positive alpha after fees is exceedingly rare. They point to studies showing that a majority of active funds underperform their benchmarks over long periods. In this view, investors are better off with low-cost index funds that simply track the market and capture market returns (beta), rather than paying high fees for elusive alpha.
-
The Active Argument: Advocates for active management contend that skilled managers can and do generate alpha, especially in less efficient markets or specific asset classes. They argue that identifying these select managers is key. Alpha provides the empirical evidence to support this claim, demonstrating the value added by successful active strategies.
For individual investors, the takeaway is not necessarily to choose one philosophy exclusively, but to use alpha as a critical filter. If an active fund cannot demonstrate a consistent, positive alpha net of fees, then the passive option becomes highly compelling. If, however, a manager consistently delivers significant alpha, it could be a valuable component of a diversified portfolio.
Tools and Resources for Calculating Alpha
While the formula for alpha is straightforward, manually collecting all the necessary data (historical returns, risk-free rates, benchmark returns, and calculating beta via regression) can be time-consuming. Fortunately, numerous financial tools and resources simplify this process:
-
Financial Software Platforms: Professional-grade platforms like Bloomberg Terminal, Refinitiv Eikon, or FactSet offer robust analytical tools that can calculate alpha and a host of other performance metrics instantly for a wide range of securities and funds.
-
Online Financial Calculators: Many financial websites (e.g., Morningstar, Investopedia, major brokerage firms) provide free or subscription-based calculators that can compute alpha given basic inputs.
-
Spreadsheet Software: For those comfortable with Excel or Google Sheets, beta can be calculated using the
SLOPEfunction, and then alpha can be derived using the formula. This requires downloading historical price data for the portfolio and its benchmark from financial data providers. -
Robo-Advisors and Investment Apps: Some modern investment platforms and robo-advisors are starting to incorporate more sophisticated performance analytics, including alpha, to help users understand their portfolio’s performance.
In conclusion, alpha is far more than just a theoretical concept; it’s a practical, indispensable metric for assessing investment performance. By dissecting returns into market-driven components (beta) and manager-driven skill (alpha), investors gain unparalleled clarity on where true value is being added or subtracted. While its calculation requires careful data selection and an understanding of its limitations, mastering alpha empowers investors to make more intelligent decisions, distinguish genuine outperformance from mere market exposure, and ultimately, build more robust and effective investment portfolios.
aViewFromTheCave is a participant in the Amazon Services LLC Associates Program, an affiliate advertising program designed to provide a means for sites to earn advertising fees by advertising and linking to Amazon.com. Amazon, the Amazon logo, AmazonSupply, and the AmazonSupply logo are trademarks of Amazon.com, Inc. or its affiliates. As an Amazon Associate we earn affiliate commissions from qualifying purchases.