
The Super Bowl is no longer just a championship game; it is a global financial phenomenon. When investors, analysts, and enthusiasts ask, “What were the odds for the Super Bowl?” they are not merely inquiring about a sports score. They are looking at the culmination of a massive, highly liquid market that functions with the precision of a stock exchange. In the most recent iteration, Super Bowl LVIII, the betting market reached unprecedented heights, with an estimated $23.1 billion wagered by Americans alone. To understand the odds is to understand the mechanics of price discovery, risk management, and the institutional business of oddsmaking.
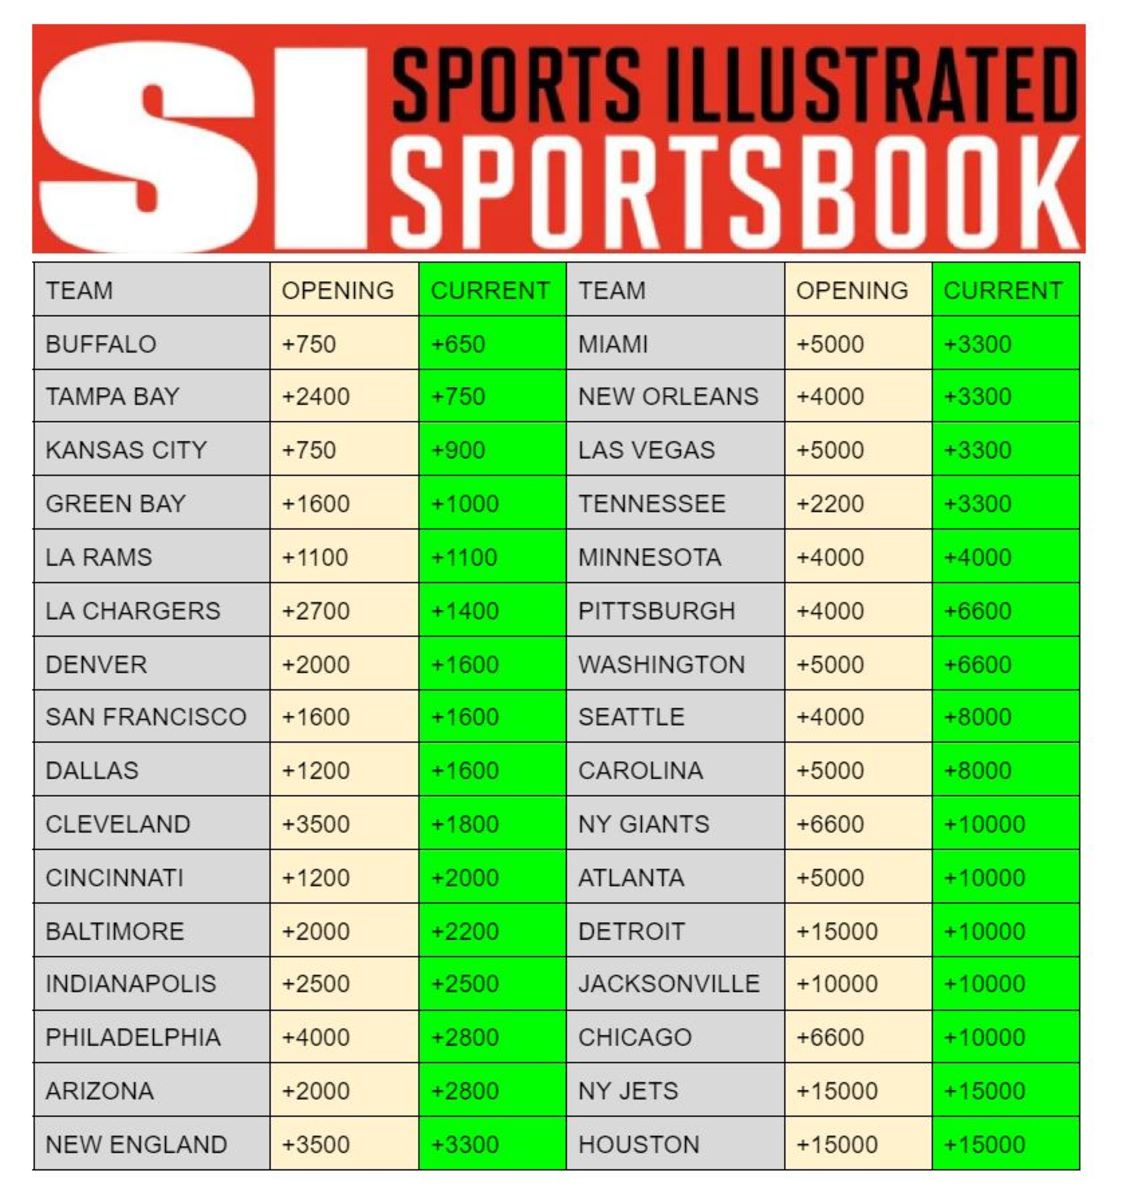
From a financial perspective, the Super Bowl odds represent the “price” of a particular outcome. Just as a stock price reflects the collective sentiment and data points of the market, the point spread and moneyline reflect the consensus of where the value lies between two competing entities. Analyzing these odds requires a deep dive into how these prices are set, how they move in response to capital flow, and what they reveal about the broader economic landscape of sports betting.
Understanding the Market: The Evolution of Super Bowl Odds
The financial lifecycle of Super Bowl odds begins the moment the conference championship games conclude. This period, often referred to as the “opening of the market,” sets the baseline for two weeks of intense financial activity.
The Opening Line vs. The Closing Line
For Super Bowl LVIII, the San Francisco 49ers opened as slight favorites over the Kansas City Chiefs. Initial lines typically hovered around 1.5 to 2 points. In financial terms, the opening line is the “initial public offering” (IPO) of the game. It is the bookmaker’s best estimate of a price that will attract equal action on both sides, thereby mitigating the house’s risk.
The “closing line,” however, is the most important metric for professional analysts. This is the final price offered just before kickoff. For the most recent Super Bowl, the line remained relatively stable, closing around 49ers -2. This stability indicates a highly “efficient” market. In markets with low liquidity, prices can swing wildly; however, because the Super Bowl attracts billions of dollars, the price discovery process is incredibly robust. By the time the game starts, the odds have been poked, prodded, and tested by millions of data points, making the closing line a remarkably accurate reflection of the perceived probability of the outcome.
Market Efficiency and the Wisdom of the Crowds
The concept of the “Efficient Market Hypothesis” (EMH) suggests that asset prices reflect all available information. The Super Bowl betting market is perhaps the closest the sports world gets to a perfectly efficient market. Because the volume of money is so high, any “mispricing” by the oddsmakers is immediately corrected by “sharp” bettors—professional gamblers who operate much like hedge fund managers.
If the odds were significantly off—for example, if the Chiefs were listed as 10-point underdogs when they should have been 2-point underdogs—large sums of capital would flood the market to exploit that inefficiency, forcing the bookmakers to adjust the price. This constant tug-of-war between public perception and professional capital ensures that the final odds are a distilled representation of the game’s likely reality.
The Business of the Book: How Odds Generate Corporate Revenue
To understand the odds, one must understand the business model of the entities providing them. Sportsbooks like FanDuel, DraftKings, and BetMGM do not operate as “gamblers”; they operate as market makers. Their goal is not to predict the winner, but to balance their “books” so that they profit regardless of the outcome.
The Role of the “Vig” or Juice
The primary source of revenue for sportsbooks is the “vig” (short for vigorish) or the “juice.” This is essentially the transaction fee or the spread in a financial trade. When you see odds of -110 on both sides of a point spread, it means a bettor must risk $110 to win $100. The $10 difference is the house’s commission.
During the Super Bowl, the sheer volume of bets allows sportsbooks to realize this margin with high consistency. If a book takes $100 million in bets on the 49ers and $100 million on the Chiefs at -110 odds, they are guaranteed a profit of roughly $9 million (the juice), provided the game doesn’t land on a “middle” that forces a payout on both sides. This is the ultimate “low-risk, high-volume” business model during the biggest sporting event of the year.
Customer Acquisition Costs and Lifetime Value
The Super Bowl is also a critical period for “Customer Acquisition Cost” (CAC) analysis. Major sportsbooks spend hundreds of millions of dollars on marketing during the Super Bowl window. The odds themselves are often used as “loss leaders.” You may see “boosted odds” or “no-sweat bets” where the book effectively gives up its margin or offers a price that is statistically in favor of the bettor.

From a corporate finance perspective, this is a calculated move. The goal is to onboard new users into the ecosystem, banking on the “Lifetime Value” (LTV) of the customer. The odds for the Super Bowl serve as the entry point for a long-term financial relationship between the consumer and the platform.
Investment Strategies: Applying Financial Principles to the Super Bowl
For the individual, engaging with Super Bowl odds should be viewed through the lens of capital allocation and risk management. Treating sports betting as a speculative asset class requires the same discipline as trading equities or commodities.
Expected Value (EV) and Bankroll Management
Sophisticated participants in the Super Bowl market look for “Positive Expected Value” (+EV). This is a mathematical calculation that determines the long-term profitability of a bet. If the odds suggest a team has a 50% chance of winning (expressed as +100), but your model suggests they have a 55% chance, you have found a +EV opportunity.
Crucial to this is “bankroll management.” Professional bettors never risk their entire capital on a single game, regardless of the event’s scale. They use formulas like the Kelly Criterion to determine the optimal size of a wager based on the perceived edge and the size of their total investment fund. This prevents “ruin”—the total loss of capital—during periods of high volatility.
Hedging as a Risk Management Tool
The Super Bowl offers a unique environment for “hedging.” Many bettors hold futures tickets purchased months in advance—for example, a ticket on the Kansas City Chiefs to win the Super Bowl bought at +1200 odds in September. By the time the Super Bowl arrives, that ticket has significant “unrealized value.”
To protect this value, an investor might “hedge” by betting on the opposing team (the 49ers) in the Super Bowl. This locks in a guaranteed profit regardless of who wins the game. This strategy is identical to a trader buying a “put option” to protect a long position in a volatile stock. It is a sophisticated method of managing downside risk while participating in a high-stakes market.
The Macroeconomic Footprint of Super Bowl Wagering
The odds for the Super Bowl also serve as a barometer for consumer confidence and discretionary spending. The “handle”—the total amount of money wagered—provides insight into the health of the consumer economy.
Record-Breaking Handles and Consumer Sentiment
In recent years, the handle for the Super Bowl has climbed exponentially. This growth is driven by two main factors: the legislative expansion of sports betting across the United States and a resilient consumer base willing to allocate discretionary income to high-entertainment-value assets.
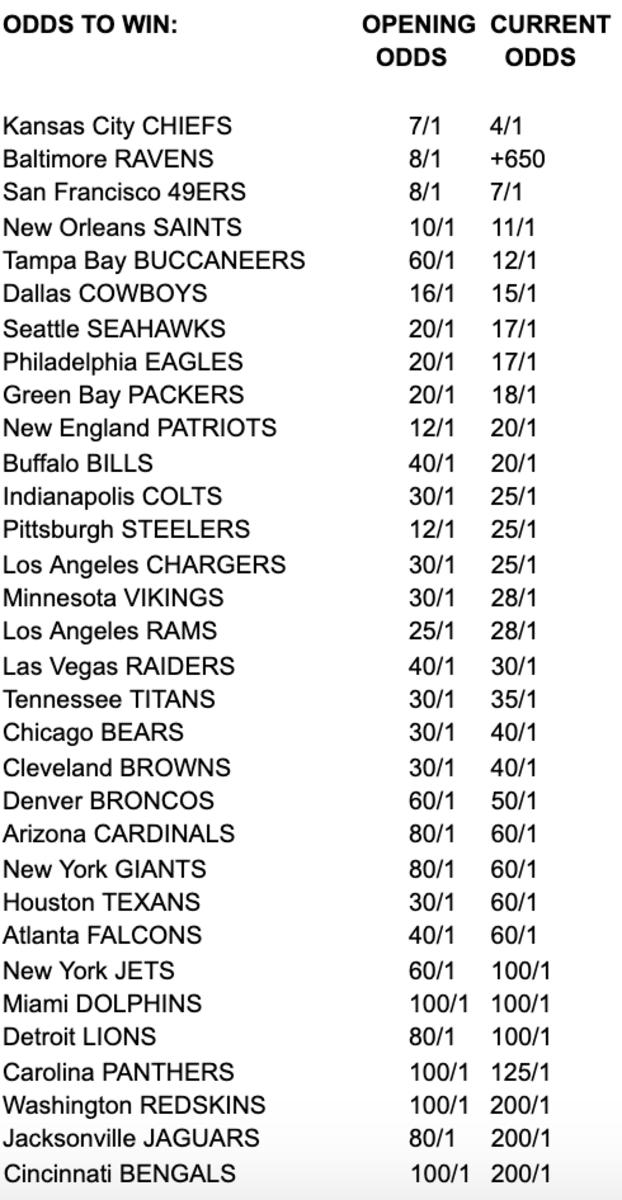
When the odds were released for Super Bowl LVIII, the immediate and massive influx of capital signaled that despite inflationary pressures, the American consumer’s appetite for high-stakes entertainment remained robust. This data is often parsed by retail analysts to gauge how much “cushion” exists in household budgets for non-essential spending.
Legalization and the Expansion of the Financial Ecosystem
The shift of Super Bowl odds from the “grey market” of offshore books to the regulated, taxed, and transparent domestic market has created a new financial ecosystem. State governments now view the Super Bowl as a significant tax revenue event. The odds aren’t just for the bettors; they are for the tax collectors.
In states where betting is legal, a portion of the “vig” goes directly into public coffers. This has led to a symbiotic relationship between sports leagues, media companies, and financial institutions. The Super Bowl odds are now integrated into pre-game broadcasts, news tickers, and financial apps, cementing their status as a mainstream financial metric.
Ultimately, the question of “what were the odds for the Super Bowl” is a gateway into a complex world of probability, market psychology, and institutional finance. Whether you are looking at the closing line as a masterpiece of market efficiency or viewing the prop bet market as a lesson in diversification, the Super Bowl remains the ultimate case study in the intersection of sports and money. It is a high-speed, high-stakes market that, for one Sunday in February, becomes the center of the financial world.
aViewFromTheCave is a participant in the Amazon Services LLC Associates Program, an affiliate advertising program designed to provide a means for sites to earn advertising fees by advertising and linking to Amazon.com. Amazon, the Amazon logo, AmazonSupply, and the AmazonSupply logo are trademarks of Amazon.com, Inc. or its affiliates. As an Amazon Associate we earn affiliate commissions from qualifying purchases.