
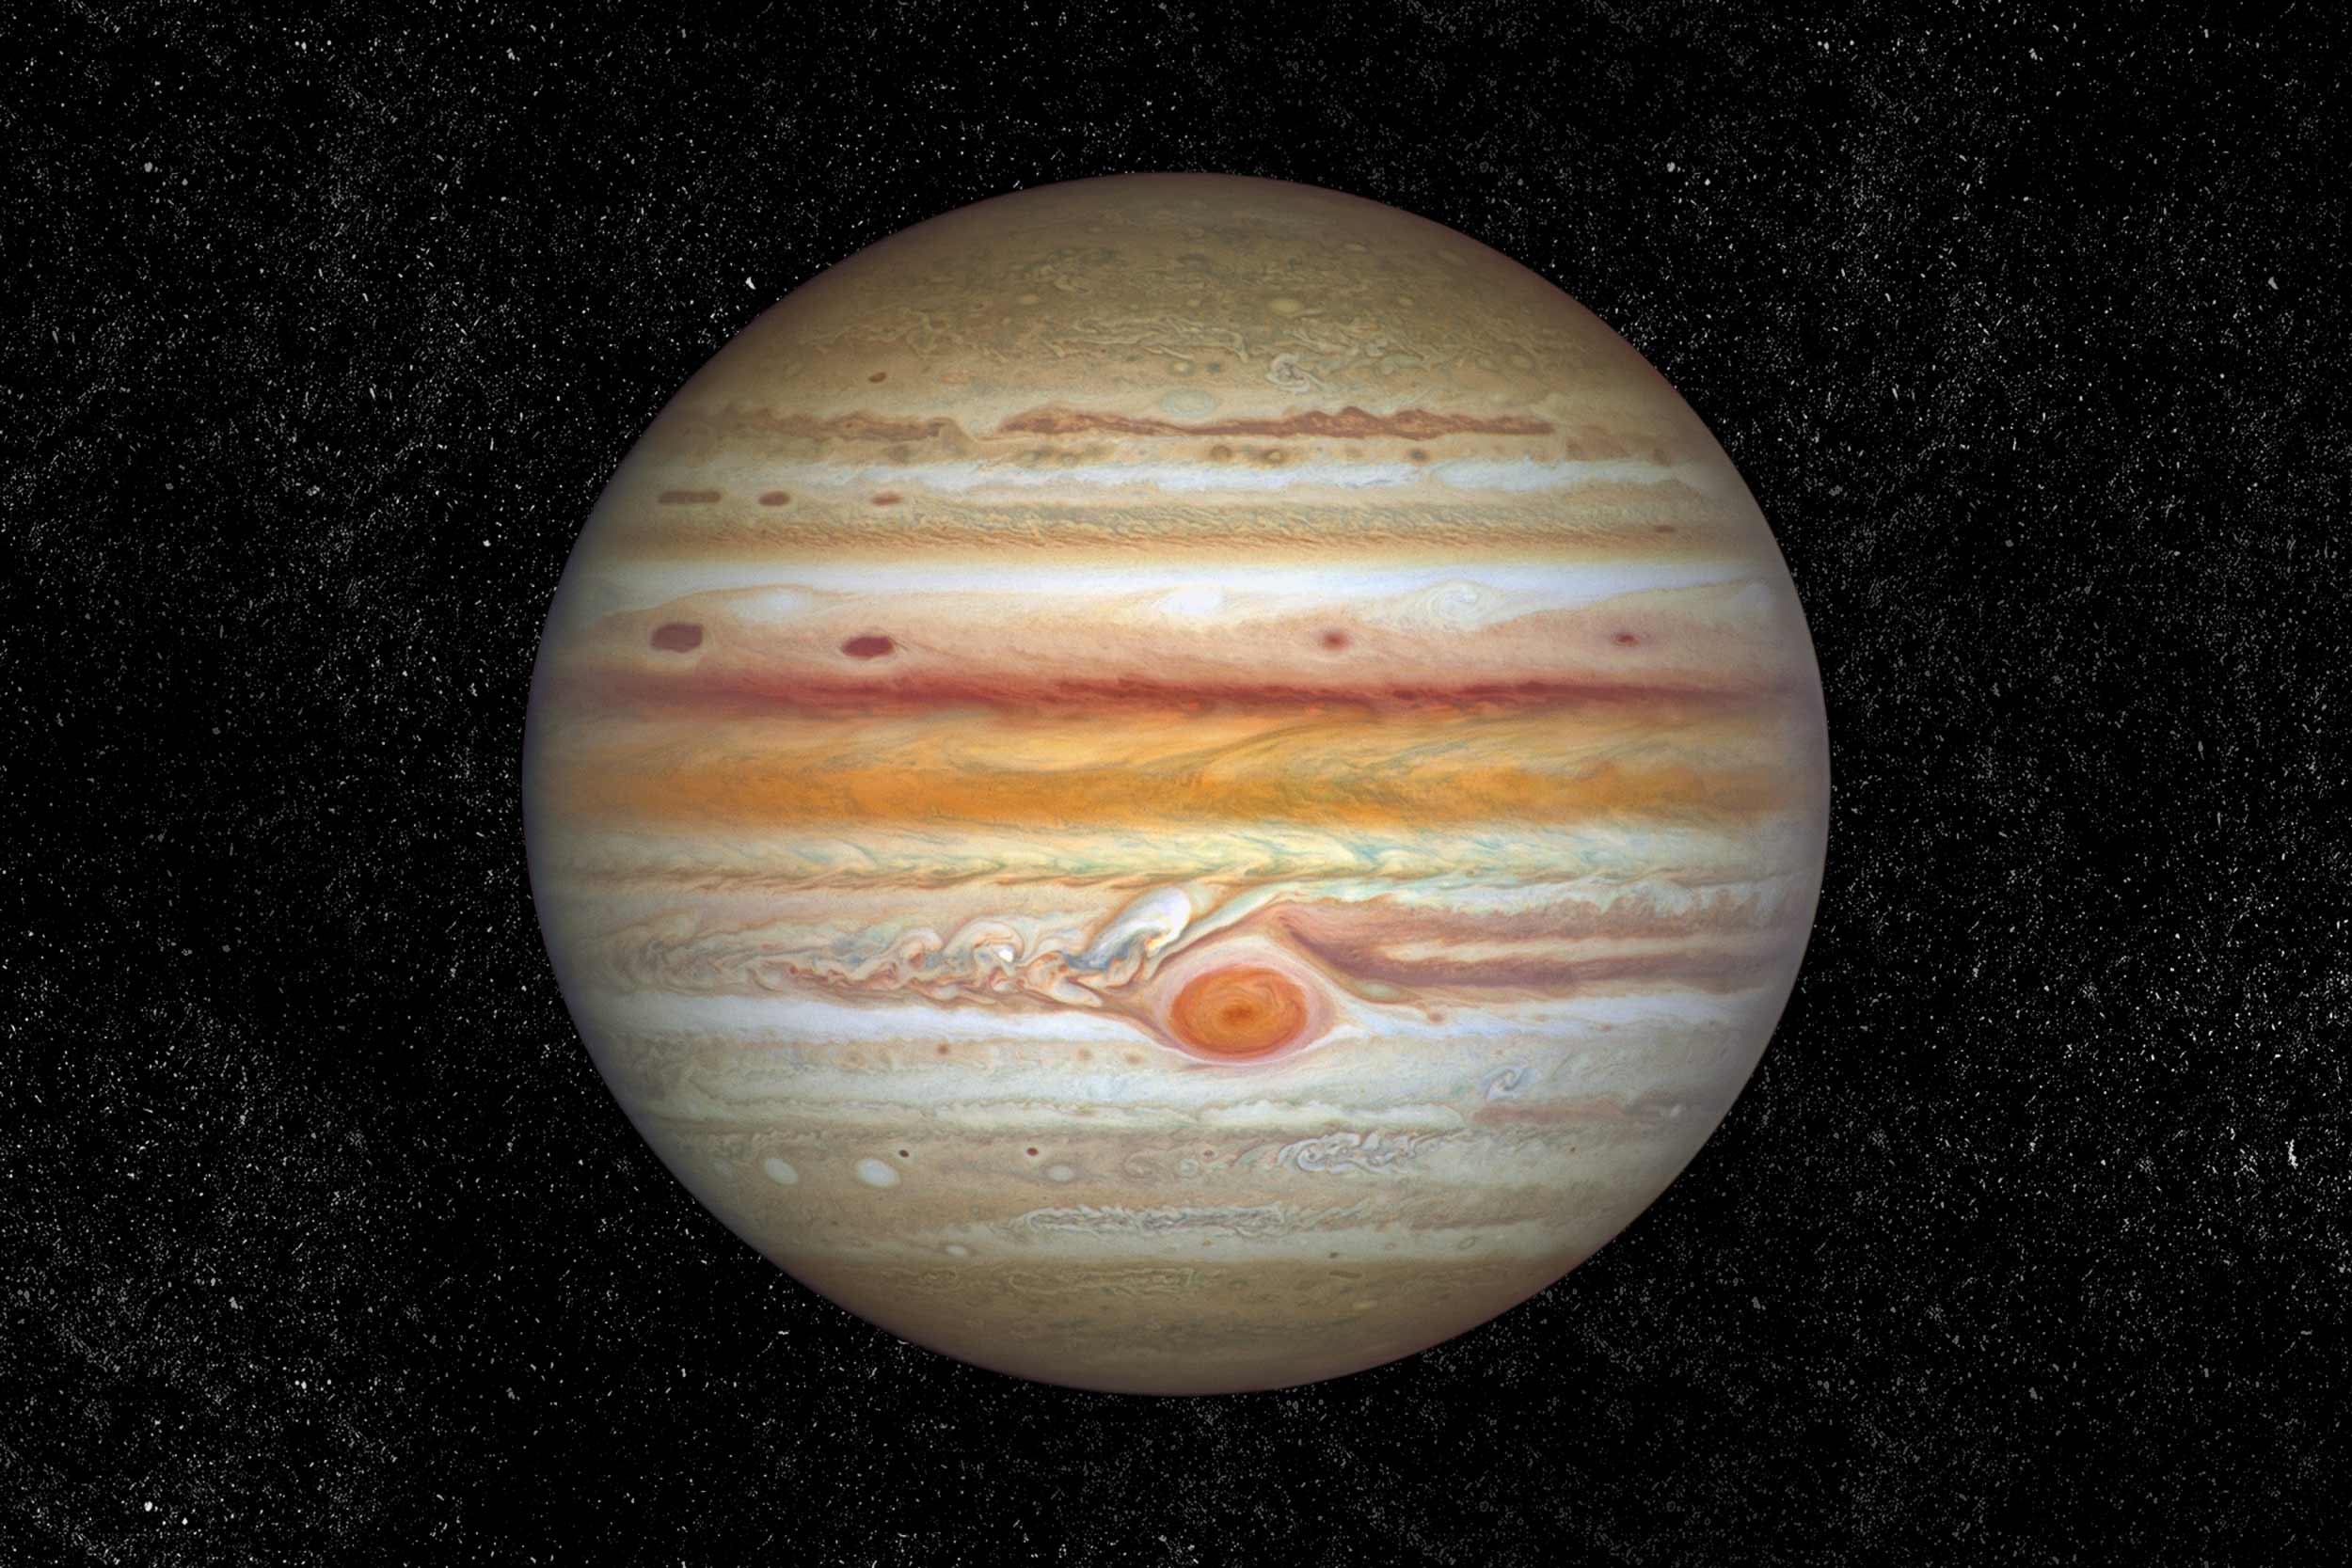
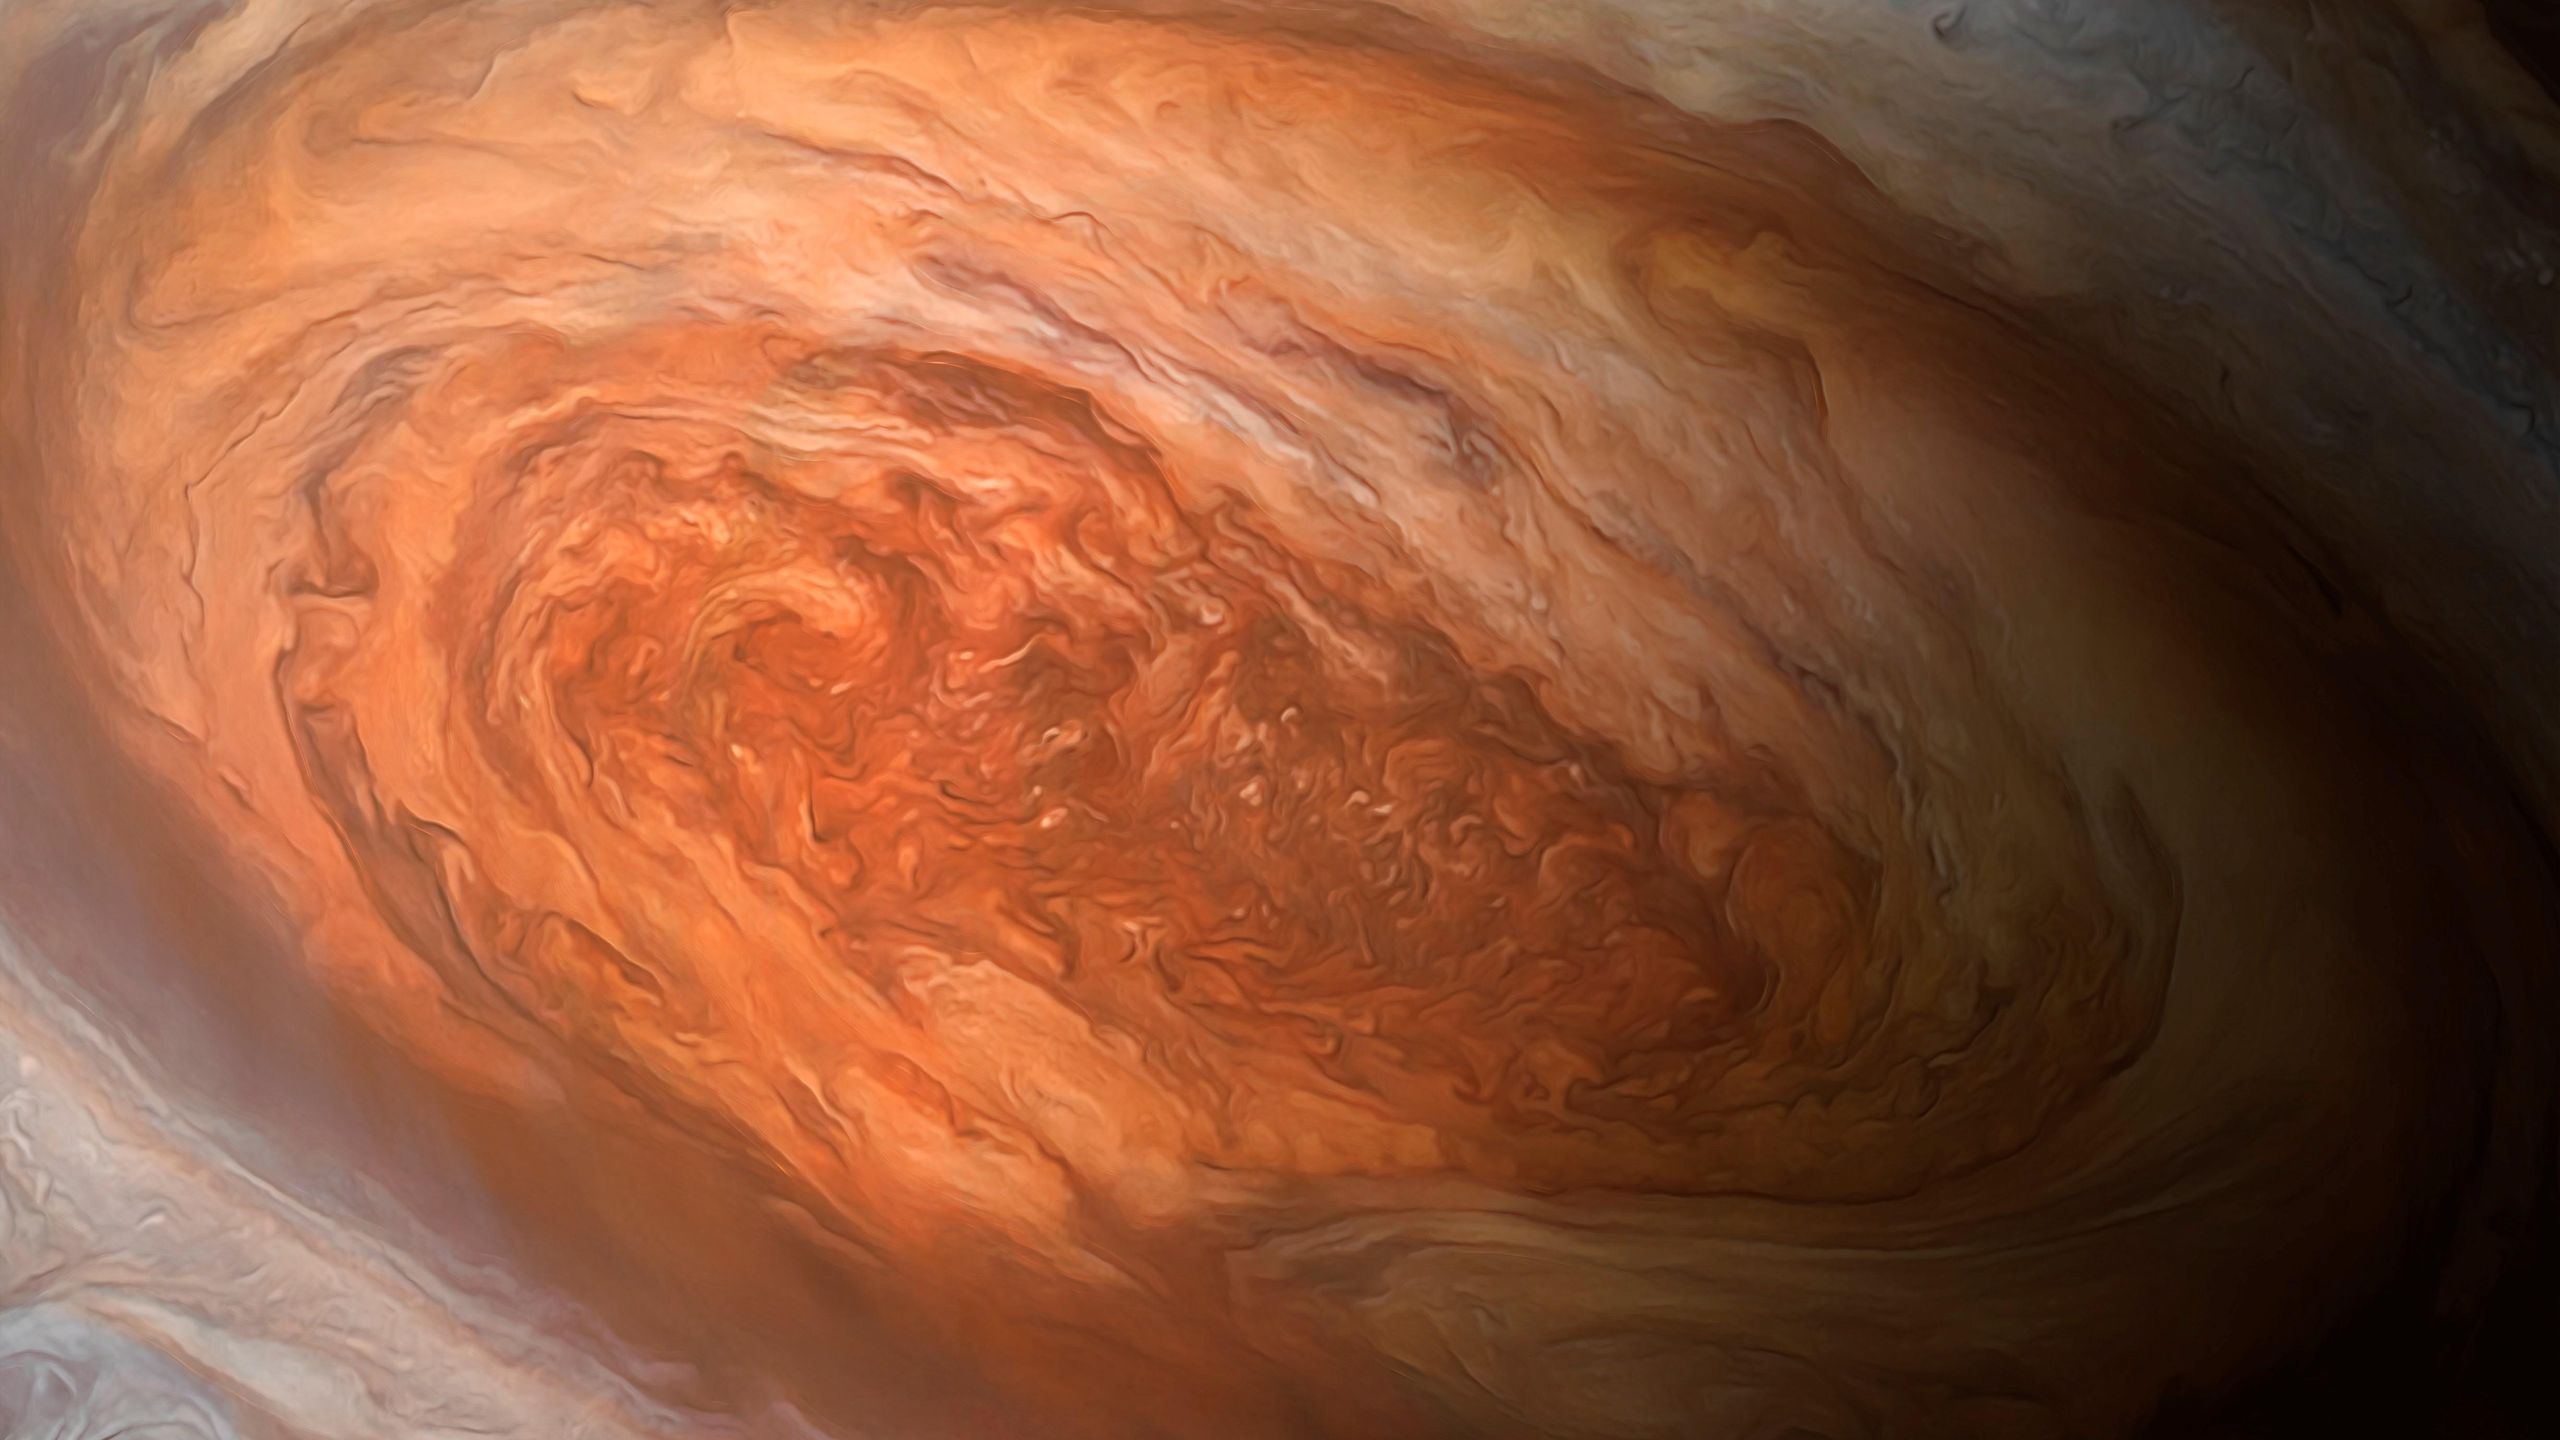
For centuries, the Great Red Spot has been the most recognizable feature of our solar system’s largest planet. To the casual observer, it is a swirling crimson blemish on the face of a gas giant. However, to the modern technology sector, the Red Spot represents one of the most complex data-gathering and computational challenges in existence. What we once perceived as a simple storm is now understood as a massive, high-pressure vortex, roughly 1.3 times the width of Earth, which has been raging for at least 300 years.

Understanding what Jupiter’s Red Spot is requires more than just a telescope; it requires an ecosystem of cutting-edge technology including advanced remote sensing, AI-driven image processing, and massive supercomputing power. By looking at the “how” behind our discovery, we can truly define the “what” of this celestial phenomenon.
The Engineering of Observation: Remote Sensing and Hardware
The primary reason we can answer the question of what the Red Spot is today—rather than merely guessing—is the advancement of deep-space hardware. The NASA Juno mission, which arrived at Jupiter in 2016, represents the pinnacle of this technological evolution. Unlike previous flyby missions, Juno was designed with a suite of instruments specifically engineered to peer through the thick Jovian clouds.
Microwave Radiometry (MWR)
One of the most critical technologies in defining the Red Spot’s structure is the Microwave Radiometer (MWR). While traditional optical cameras only see the top layer of clouds, the MWR uses six different frequencies to penetrate up to 250 miles (400 kilometers) below the visible surface. This technology revealed that the Great Red Spot is not just a surface feature; it has deep roots that extend far into the planet’s interior. The ability to measure thermal emission from the deep atmosphere has changed our definition of the storm from a “weather pattern” to a “deep-seated atmospheric anchor.”
Gravity Science and Mass Distribution
To understand the mass of the Red Spot, scientists utilize the Deep Space Network (DSN) to track minute changes in the Juno spacecraft’s velocity. As the probe passes over the Red Spot, the storm’s localized mass slightly alters the spacecraft’s trajectory. This shift is measured via the Doppler effect in radio signals sent back to Earth. This level of precision—detecting changes in movement as small as a few millimeters per second from millions of miles away—allows tech teams to map the gravitational signature of the storm, providing a physical “weight” to the Red Spot.
Software and AI: Transforming Raw Data into Insight
The data captured by space probes is not delivered as a crisp, high-definition photograph. Instead, it arrives as “raw data”—binary code, radiation readings, and noise. The transformation of this data into the iconic images we recognize is a feat of software engineering and artificial intelligence.
AI-Driven Image Reconstruction
The JunoCam, the “eyes” of the Juno mission, produces raw images that are often distorted by the spacecraft’s high-speed rotation and the intense radiation environment of Jupiter. To solve this, researchers use sophisticated image-processing algorithms. AI tools are employed to perform “denoising,” where machine learning models are trained to distinguish between actual atmospheric features and artifacts caused by cosmic radiation.
Furthermore, “super-resolution” software allows scientists to stitch together multiple low-resolution captures to create a high-fidelity mosaic. This software doesn’t just “guess” what the pixels should look like; it uses physics-based constraints to ensure that the reconstructed image of the Red Spot aligns with the known fluid dynamics of the Jovian atmosphere.
Citizen Science Platforms and Collaborative Software
The processing of Red Spot data has become a global collaborative tech project. Through platforms like the JunoCam website, NASA provides raw FITS (Flexible Image Transport System) files to the public. Citizen scientists—ranging from software developers to digital artists—use professional-grade tools like Adobe Photoshop, PixInsight, and custom Python scripts to process these images. This crowdsourced approach to data processing has led to some of the most detailed views of the Red Spot’s “filaments” and “eddies,” proving that software democratization is essential for modern planetary science.
Computational Fluid Dynamics and Supercomputing
At its core, the Red Spot is a problem of fluid dynamics on a planetary scale. To understand why it persists and why its color changes, researchers rely on massive computational power.
Simulating the Jovian Atmosphere
To answer what the Red Spot is, we must model it. This is done using Computational Fluid Dynamics (CFD) software running on some of the world’s most powerful supercomputers. These models simulate a gas giant’s atmosphere by solving the Navier-Stokes equations—the mathematical foundation of fluid flow—on a global scale.
Because Jupiter rotates every 10 hours, the Coriolis forces are extreme. Supercomputers must calculate billions of interactions between different atmospheric layers, accounting for heat from the planet’s core and the cooling effects of space. These simulations have shown that the Red Spot is a “heat sink,” trapping energy and creating a vertical structure that pumps heat from the deep atmosphere into the upper layers. Without these high-performance computing (HPC) clusters, the internal mechanics of the spot would remain a mystery.
Predictive Modeling and Longevity
One of the most pressing tech-driven questions is: “Is the Red Spot dying?” Observations over the last century show the spot is shrinking. By feeding historical data into predictive algorithms, scientists are attempting to forecast the storm’s lifespan. These AI models analyze trends in wind speed, chemical composition, and size to predict whether the spot will stabilize or eventually dissipate. This is essentially the same “big data” approach used in climate modeling on Earth, adapted for a different chemical environment.
The Future of Deep Space Tech and Exploration
The technology we use to study Jupiter’s Red Spot is currently undergoing a generational shift. As we look toward future missions like the ESA’s JUICE (JupitEr ICy moons Explorer) and NASA’s Europa Clipper, the tech stack for planetary observation is becoming more autonomous and resilient.
Edge Computing in Deep Space
One of the primary bottlenecks in space exploration is bandwidth. Sending high-resolution data from Jupiter to Earth via the Deep Space Network is a slow process. The next generation of probes will likely utilize “Edge Computing”—onboard AI that can analyze data in real-time and decide which segments are most important to transmit. For the Red Spot, this means a probe could detect a sudden change in storm activity (such as a “flaking” event) and automatically prioritize high-speed spectral capture of that specific area.
Next-Gen Sensors: Laser and Spectroscopy
Future tech will move beyond microwave and infrared. Advanced laser altimetry and high-resolution spectroscopy will allow us to map the chemical “signature” of the Red Spot with unprecedented accuracy. By analyzing how light reflects off the storm’s clouds, these sensors can identify the specific compounds—such as ammonium hydrosulfide or phosphorus—that give the spot its distinctive red hue. This is essentially “chemical forensics” at a distance of 400 million miles.
Cybersecurity and Deep Space Assets
As space technology becomes more sophisticated, the digital security of our observation tools becomes paramount. The commands sent to Juno or future probes are encrypted and authenticated via secure protocols to prevent interference. Protecting the integrity of the data stream from the Red Spot is as important as the hardware itself, ensuring that the insights we gain are accurate and free from digital corruption.
Conclusion: A Digital Perspective on a Celestial Giant
When we ask “What is Jupiter’s Red Spot?”, we are no longer looking for a simple description of a storm. Through the lens of modern technology, the Red Spot is a massive data set, a complex fluid dynamics simulation, and a testing ground for the most advanced sensors and AI models ever built.
It is a testament to human ingenuity that we can define the chemical composition, the depth, and the gravitational pull of a vortex we have never physically touched. The Red Spot is a reminder that in the modern era, the boundaries of our knowledge are defined by the sophistication of our technology. As our software becomes more intelligent and our hardware more durable, our definition of this Jovian icon will continue to evolve, moving us closer to a complete understanding of the mechanics of our solar system.
aViewFromTheCave is a participant in the Amazon Services LLC Associates Program, an affiliate advertising program designed to provide a means for sites to earn advertising fees by advertising and linking to Amazon.com. Amazon, the Amazon logo, AmazonSupply, and the AmazonSupply logo are trademarks of Amazon.com, Inc. or its affiliates. As an Amazon Associate we earn affiliate commissions from qualifying purchases.