In the realms of personal finance and business management, the ability to accurately calculate increase is more than just a mathematical exercise; it is a fundamental skill for survival and success. Whether you are tracking the growth of a stock portfolio, assessing a year-over-year revenue surge in a startup, or evaluating a cost-of-living salary adjustment, understanding the mechanics of financial expansion allows for data-driven decision-making.
Quantifying growth provides a clear picture of performance, stripping away the ambiguity of “feeling” successful and replacing it with hard evidence. This guide explores the essential methodologies for calculating various types of financial increases, from basic percentage shifts to complex compound growth rates, ensuring you have the tools to navigate the modern economic landscape.

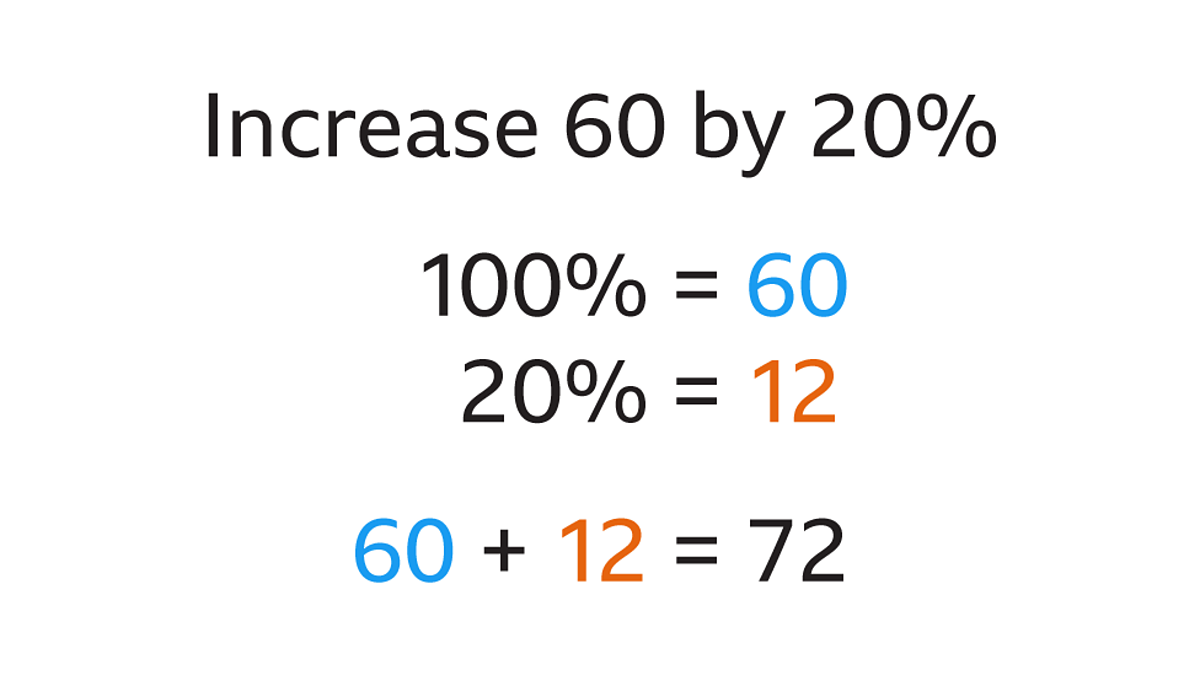
1. The Fundamental Formula for Percentage Increase
At its core, calculating an increase is about measuring the change between two points in time. In the world of money, the most common way to express this change is through a percentage. This standardizes growth, making it easy to compare the performance of a $100 investment with a $10,000 investment.
The Core Mathematics
The universal formula for percentage increase is straightforward:
((New Value – Old Value) / Old Value) x 100 = Percentage Increase
To apply this, you first subtract the original amount (the “Old Value”) from the current amount (the “New Value”). This result represents the absolute increase. You then divide that absolute increase by the original amount to determine what fraction of the original the growth represents. Finally, multiplying by 100 converts that decimal into a percentage.
For example, if your monthly side-hustle income grew from $500 last month to $650 this month, the calculation would be:
($650 – $500) / $500 = 0.3.
0.3 x 100 = 30%.
In this scenario, you have achieved a 30% increase in monthly earnings.
Real-World Applications in Personal Budgeting
In personal finance, this formula is invaluable for monitoring expenses and savings goals. If you are tracking your “burn rate”—the amount of money you spend each month—calculating the percentage increase in utility bills or grocery costs can highlight inflationary pressures or lifestyle creep.
If your grocery bill was $400 in January and rose to $460 in February, that is a 15% increase. Recognizing this specific figure allows you to adjust your budget proactively rather than wondering why your bank account balance is lower than expected at the end of the month. Conversely, you can use the same formula to track the growth of your emergency fund, providing a psychological boost as you see your financial security net expand by measurable increments.
2. Measuring Investment Performance and ROI
While basic percentage increases are useful for short-term snapshots, investing requires a more nuanced approach. When dealing with assets like stocks, bonds, or real estate, you must account for different variables, including the time horizon and the reinvestment of gains.
Simple Return vs. Total Return
When calculating the increase in an investment’s value, many beginners look only at the price appreciation. This is known as the “Price Return.” However, a professional financial analysis requires looking at the “Total Return.”
Total Return includes the price increase plus any income generated by the asset, such as dividends from stocks or interest from bonds. If you bought a share of a company for $100 and it rose to $110, the price increase is 10%. However, if that company also paid you a $2 dividend during that period, your total increase is actually 12%.
Total Return Formula: ((Final Value + Income – Initial Investment) / Initial Investment) x 100.
Compound Annual Growth Rate (CAGR)
The most significant limitation of a simple percentage increase is that it doesn’t account for the “time value” of money over several years. If an investment grows by 50% over ten years, that is very different from an investment growing 50% in one year.
To compare investments fairly over different timeframes, financial professionals use the Compound Annual Growth Rate (CAGR). This metric provides a smoothed annual rate of return, assuming the investment grew at a steady rate each year with gains being reinvested.
CAGR Formula: [(Ending Value / Beginning Value)^(1 / Number of Years)] – 1.
CAGR is the gold standard for evaluating long-term wealth building. It allows an investor to look past the “noise” of yearly market volatility and understand the true pace at which their capital is compounding.
3. Business Finance: Calculating Revenue and Profit Growth
For business owners and corporate analysts, calculating increase is a daily requirement. It is the primary way to communicate the health of a company to stakeholders, investors, and employees.
Year-over-Year (YoY) and Month-over-Month (MoM) Increase
Business performance is rarely viewed in isolation; it is viewed in comparison to previous cycles.
- YoY Increase: This compares a specific period with the same period from the previous year (e.g., Q3 2023 vs. Q3 2022). This is vital for businesses with seasonal fluctuations, such as retail outlets that see a massive surge in December.
- MoM Increase: This measures the growth from one month to the next. This is a critical “pulse” metric for early-stage startups that need to demonstrate rapid traction to secure venture capital.
By calculating these increases, a business can identify whether a sudden jump in sales is a genuine growth trend or merely a predictable seasonal peak.
Gross and Net Margin Improvements
Growth isn’t just about making more money (revenue); it’s also about keeping more money (profit). A business might see a 20% increase in revenue but a 30% increase in expenses, meaning the business is actually becoming less healthy despite the higher sales figures.
Calculating the increase in profit margins is essential.
- Gross Margin Increase: This shows how efficiently a company is producing its goods. If the gross margin increases from 40% to 45%, the company has likely reduced its manufacturing costs or raised its prices effectively.
- Net Margin Increase: This is the “bottom line.” It shows how much of every dollar earned actually becomes profit after all expenses, taxes, and interest are paid. Calculating the increase in net margin is the ultimate indicator of a business’s operational efficiency and scaling potential.
4. Inflation and Purchasing Power Adjustments
In a fluctuating economy, a numerical increase in money does not always equate to an increase in wealth. This is where the distinction between “Nominal” and “Real” increases becomes vital.
Nominal vs. Real Increases
A Nominal Increase is the raw percentage growth of your money. If you received a 5% raise at work, your nominal income increased by 5%.
A Real Increase, however, accounts for inflation. Inflation is the rate at which the general level of prices for goods and services is rising. If you receive a 5% raise, but the inflation rate for that year is 6%, your “Real” increase is actually -1%. In terms of purchasing power, you are actually poorer than you were the year before, despite having a larger number on your paycheck.
Adjusting for the Consumer Price Index (CPI)
To calculate a “Real” increase, you must use the Consumer Price Index (CPI), which tracks the average change over time in the prices paid by consumers for a market basket of goods and services.
Real Increase Formula: ((1 + Nominal Growth Rate) / (1 + Inflation Rate)) – 1.
For anyone managing a long-term retirement fund or a business’s cash reserves, calculating the increase relative to inflation is the only way to ensure that the value of the capital is actually being preserved or grown. Ignoring inflation is a common pitfall that can lead to a false sense of financial security.
5. Advanced Tools and Strategies for Maximizing Financial Increase
Once you understand how to calculate these metrics, the next step is applying them systematically to drive future growth. Manual calculations are great for understanding the logic, but professional-grade financial management requires leverage.
Leveraging Financial Software and Spreadsheets
In the modern era, tools like Microsoft Excel or Google Sheets are the primary environments for calculating increase. The formula = (New_Cell - Old_Cell) / Old_Cell formatted as a percentage can handle thousands of data points instantly.
For more advanced analysis, financial software and portfolio trackers automatically calculate your CAGR, dividend yield, and volatility-adjusted returns. These tools allow you to perform “What-If” analysis. For example, you can calculate how much you need to increase your monthly investment contributions to reach a specific net worth goal within ten years, accounting for an expected 7% annual increase in market value.

Setting Benchmarks for Future Growth
Calculating where you are is only useful if it informs where you are going. Benchmarking involves comparing your calculated increases against industry standards or market indices.
- For Investors: Is your portfolio increase of 8% good? If the S&P 500 increased by 15% in the same period, your “increase” actually represents an underperformance relative to the market.
- For Business Owners: If your revenue increased by 10%, but your competitors are growing at 25%, you are losing market share.
By regularly calculating and benchmarking your financial increases, you move from a reactive state to a proactive one. You begin to see the levers you can pull—cutting costs, diversifying assets, or increasing prices—to ensure that the “increase” you calculate next year is even more substantial than the one you calculated today. In the world of money, those who master the math of growth are the ones who ultimately master their future.
aViewFromTheCave is a participant in the Amazon Services LLC Associates Program, an affiliate advertising program designed to provide a means for sites to earn advertising fees by advertising and linking to Amazon.com. Amazon, the Amazon logo, AmazonSupply, and the AmazonSupply logo are trademarks of Amazon.com, Inc. or its affiliates. As an Amazon Associate we earn affiliate commissions from qualifying purchases.