The question “when was the last market crash?” often arises from a place of curiosity, concern, or a desire to understand the rhythms of financial history. While the term “market crash” can evoke images of the Great Depression or Black Monday, its modern interpretation is often more nuanced, referring to swift, significant, and sometimes systemic downturns that impact investor confidence and global economies. Pinpointing the “last” market crash isn’t as simple as naming a single date; rather, it involves understanding the various types of market corrections, bear markets, and outright crashes that have punctuated financial history, with some events being more recent and impactful than others.
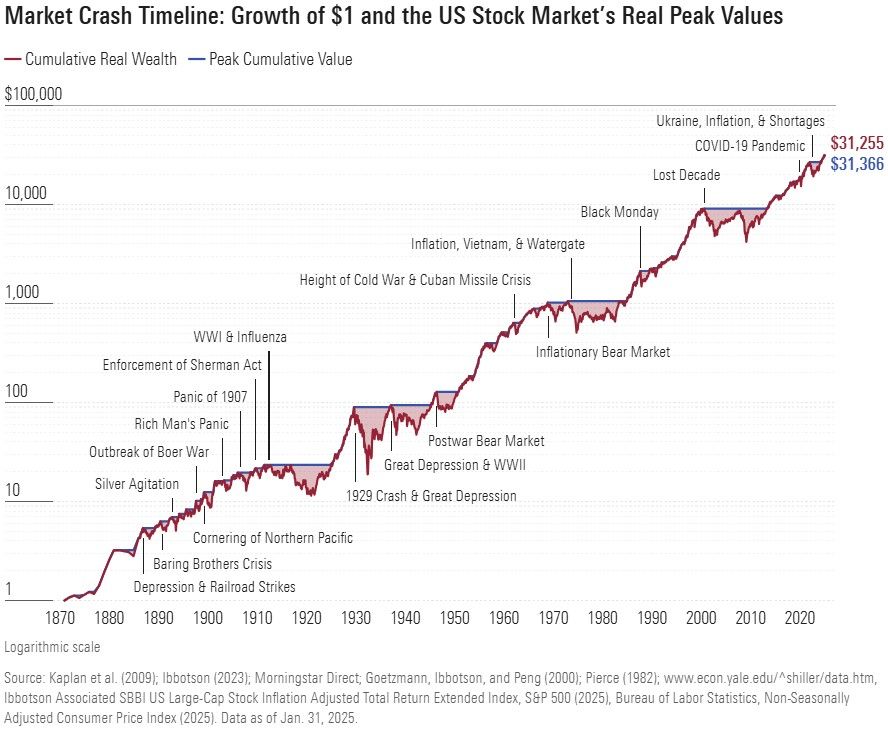
For many, the most recent universally acknowledged “market crash” occurred in March 2020, triggered by the onset of the COVID-19 pandemic. This event, while remarkably swift and severe, was also distinct in its origins and the speed of its subsequent recovery. However, to truly understand the landscape of market downturns, it’s crucial to look beyond this single event and consider other significant periods of financial stress that offer valuable lessons for investors and policymakers alike.
Defining a Market Crash: More Than Just a Dip
Before diving into specific timelines, it’s essential to clarify what constitutes a “market crash” and how it differs from other common market phenomena. Not every period of negative returns qualifies as a crash, and understanding these distinctions is key to a robust financial perspective.
What Constitutes a “Crash”?
Generally, a market crash is characterized by a sudden, significant, and often panic-driven drop in asset prices, usually across a broad market index like the S&P 500. While there’s no universally agreed-upon percentage, a decline of 20% or more from recent highs is often used as a benchmark to signify a bear market. A “crash” typically implies an even faster and more dramatic decline within that bear market territory, often fueled by fear and selling pressure.
Key characteristics often include:
- Speed: Crashes happen rapidly, sometimes within days or weeks.
- Magnitude: The percentage drop is substantial, often exceeding 20-30%.
- Panic Selling: Investor sentiment shifts dramatically from optimism to extreme fear, leading to indiscriminate selling.
- Systemic Risk: Often, crashes are accompanied or exacerbated by underlying economic or financial systemic issues.
This contrasts with a “market correction,” which is typically a shorter-term decline of 10-20% from a peak, often healthy for markets as it prunes excesses. A “bear market” is a sustained period of declining prices, often defined as a 20% or more fall from recent highs, but it doesn’t necessarily imply the rapid, panic-driven collapse characteristic of a crash. The 2020 event was unique because it rapidly moved through correction territory straight into a bear market and then rebounded with unprecedented speed.
The Psychology of Market Downturns
Understanding the quantitative definitions is only half the battle; the psychology underpinning market downturns is equally critical. Human emotions – primarily fear and greed – play an outsized role in market movements. During periods of euphoria, greed drives prices higher, often beyond fundamental valuations. Conversely, during downturns, fear takes over, leading to panic selling and a “herd mentality” where investors sell not because fundamentals have drastically changed, but because everyone else is selling.
This emotional contagion can amplify initial drops, turning minor corrections into significant market events. The pervasive influence of financial news and social media can further accelerate this cycle, creating a self-fulfilling prophecy of declining asset values. Recognizing these psychological biases is crucial for investors aiming to navigate volatile markets without succumbing to impulsive decisions.
The COVID-19 Market Plunge of 2020: A Recent Benchmark
For many, the most immediate and impactful answer to “when was the last market crash?” points directly to March 2020. This period saw one of the fastest and most dramatic sell-offs in financial history, driven by the unprecedented global health crisis.
The Onset and Causes
The initial signs of the COVID-19 pandemic emerging from Wuhan, China, began to rattle global markets in late January and early February 2020. However, the true plunge began in late February as the virus spread rapidly across Europe and the United States, prompting widespread lockdowns, travel restrictions, and declarations of national emergencies. The primary drivers were:
- Global Pandemic Fears: Uncertainty about the virus’s lethality, transmissibility, and its potential to overwhelm healthcare systems.
- Economic Shutdowns: Governments worldwide implemented severe measures, halting economic activity, closing businesses, and leading to mass unemployment.
- Supply Chain Disruptions: The interconnected global economy ground to a halt, creating immediate disruptions to supply chains and manufacturing.
- Uncertainty: Perhaps the most significant factor was the sheer lack of precedent and clarity regarding the pandemic’s duration, economic impact, and potential solutions.
The Speed and Severity
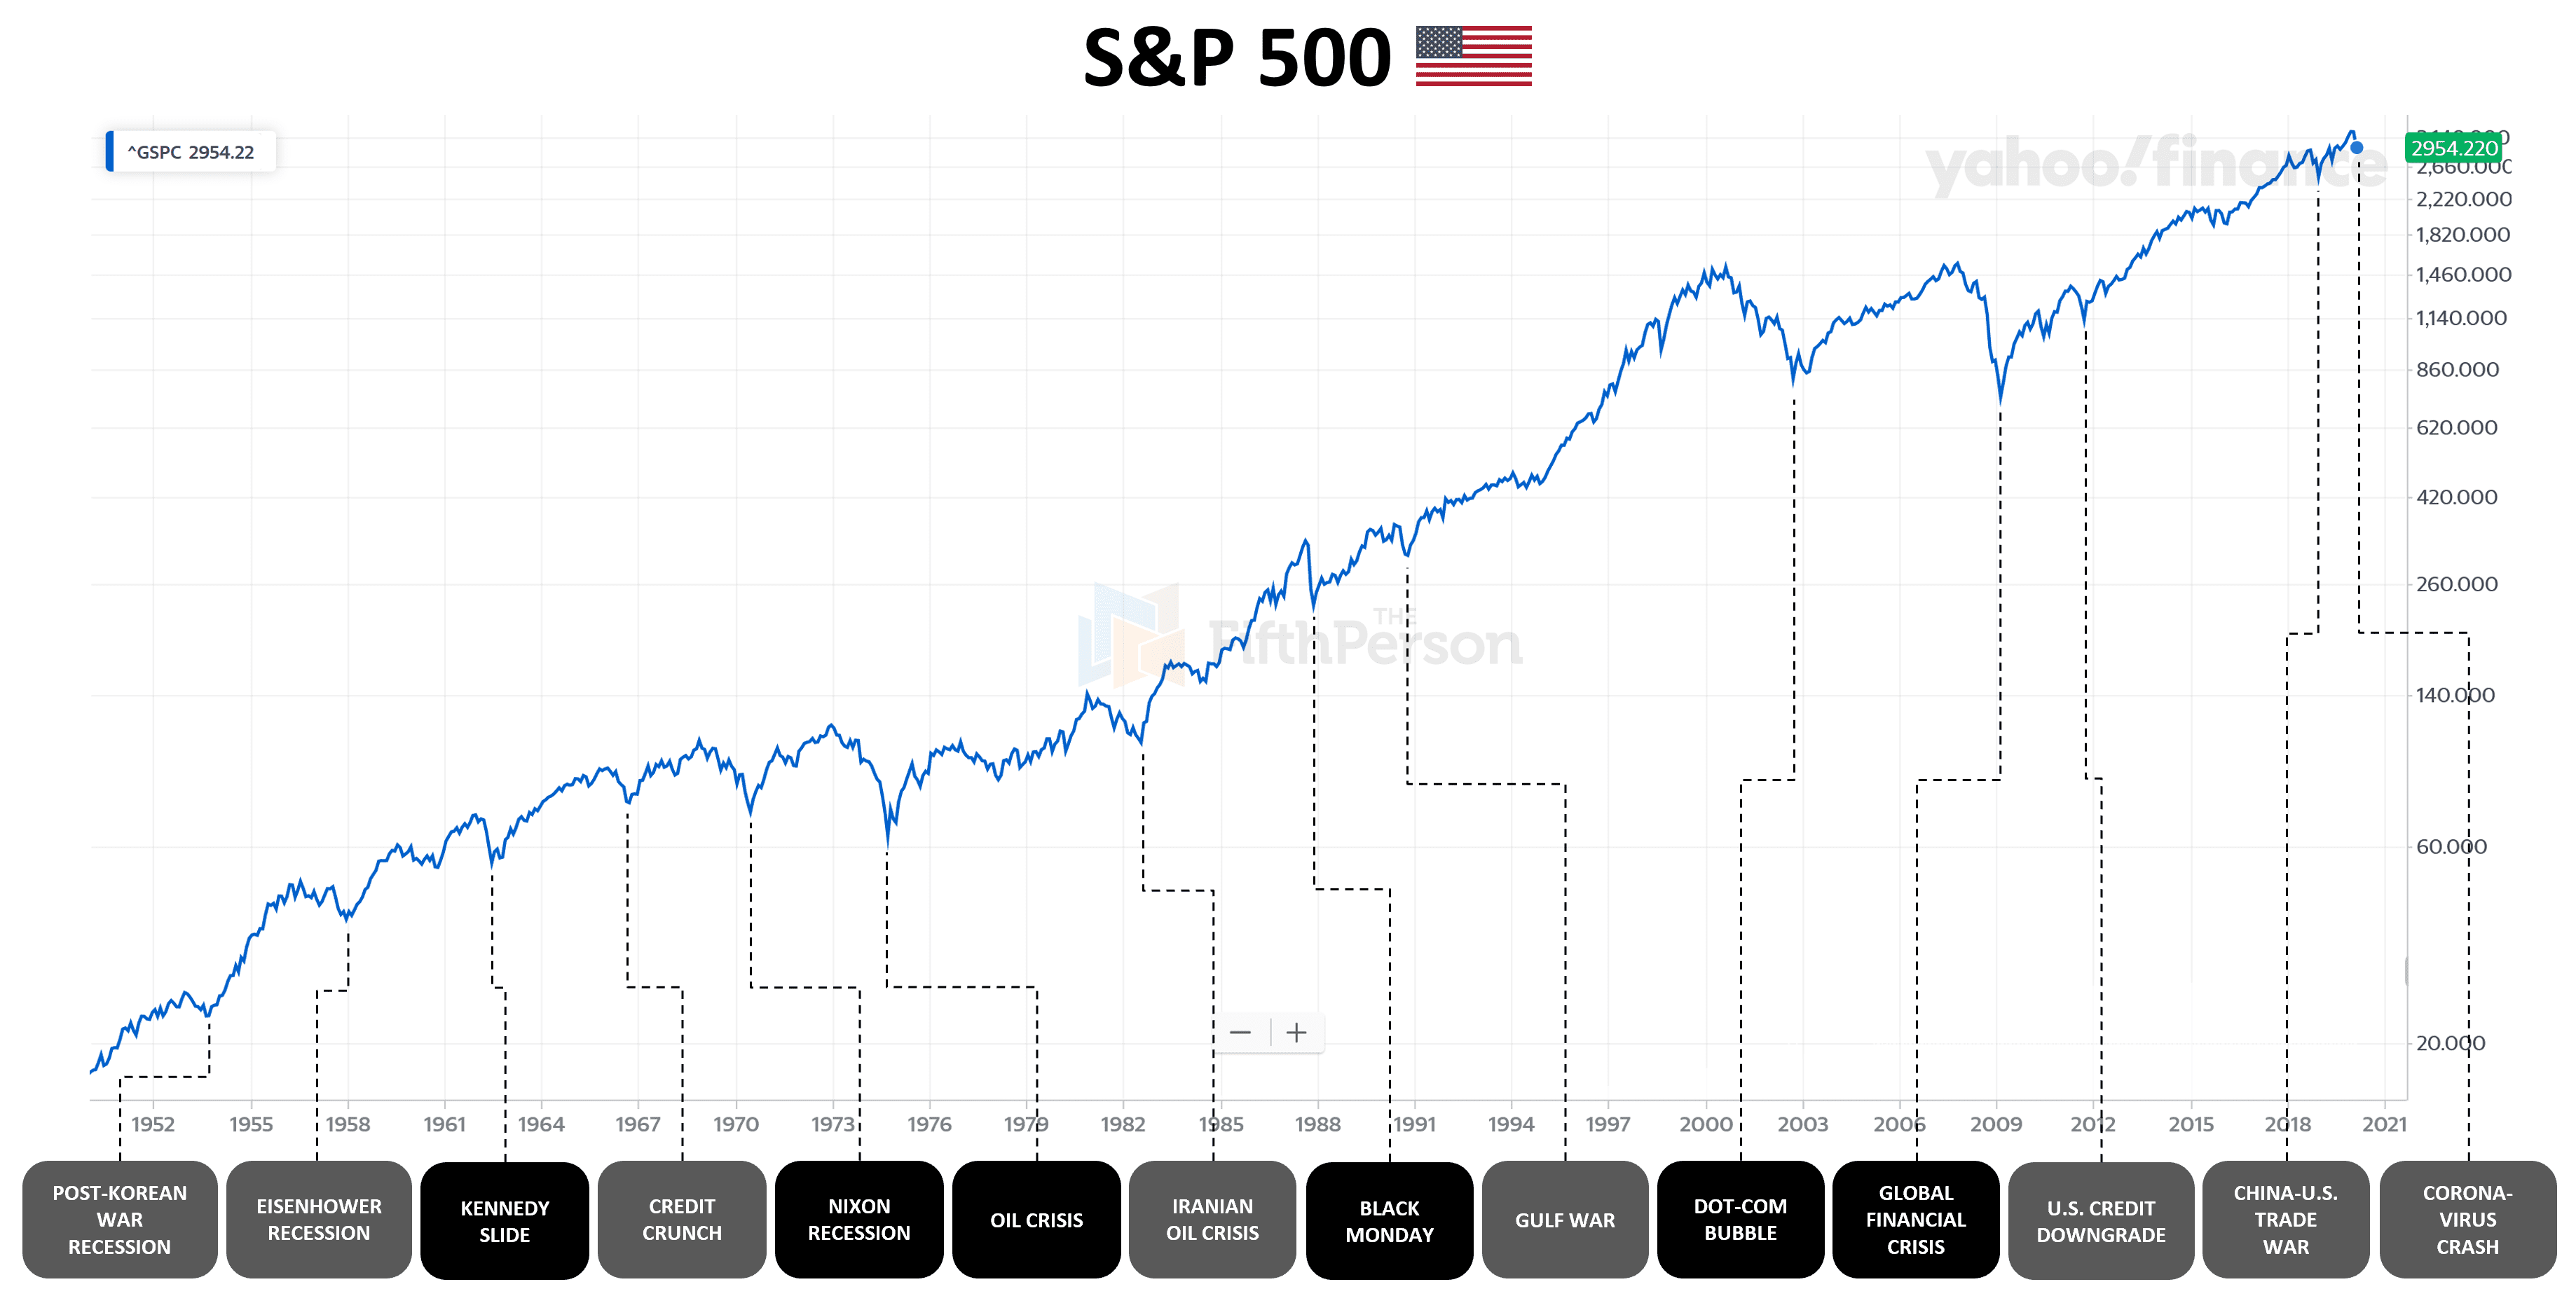
What made the 2020 downturn so notable was its speed. The S&P 500 index fell approximately 34% from its peak on February 19, 2020, to its low on March 23, 2020. This marked the fastest bear market entry in history, taking only 23 trading days to drop by over 20% from its high. The volatility, as measured by the VIX index (often called the “fear gauge”), surged to levels not seen since the 2008 financial crisis. Every asset class, from equities to commodities, experienced significant selling pressure as investors rushed to cash.
Unprecedented Policy Response and Recovery
Crucially, the 2020 crash was met with an equally unprecedented and swift policy response from governments and central banks worldwide.
- Fiscal Stimulus: Governments enacted massive fiscal packages (e.g., the CARES Act in the U.S.), providing direct aid to individuals, businesses, and industries.
- Monetary Easing: Central banks, led by the U.S. Federal Reserve, slashed interest rates to near zero, implemented aggressive quantitative easing programs (buying vast amounts of bonds), and established emergency lending facilities to ensure liquidity in financial markets.
This coordinated and overwhelming response, coupled with rapid advancements in vaccine development, contributed to a remarkably fast “V-shaped” recovery. While the economic scars of the pandemic persisted, the stock market rebounded sharply, with many indices reaching new highs within months, leaving a fascinating case study of a crash driven by an external, non-financial shock, swiftly contained by policy action.
Beyond 2020: Other Notable Recent Market Shocks
While the 2020 pandemic-induced crash is the most recent broad market event, it’s important to acknowledge other significant financial shocks that offer different insights into market behavior and systemic risks.
The 2008 Global Financial Crisis: A Precedent for Systemic Risk
The Global Financial Crisis (GFC) of 2008 remains a crucial reference point for understanding systemic risk. Triggered by the collapse of the U.S. housing bubble and the intricate web of subprime mortgages and complex financial derivatives, the GFC pushed the global financial system to the brink. This crisis was characterized by:
- Financial System Breakdown: Failures of major financial institutions (Lehman Brothers, AIG), leading to a freezing of credit markets.
- Prolonged Recession: Unlike the quick recovery of 2020, the GFC ushered in a deep and prolonged recession with high unemployment.
- Regulatory Overhaul: The crisis led to significant regulatory changes (Dodd-Frank Act in the U.S.) aimed at preventing a recurrence of such systemic failures.
While the market decline during the GFC (S&P 500 falling over 50% from late 2007 to early 2009) was deeper and more protracted than 2020, its origins were fundamentally different – stemming from within the financial system itself rather than an external health crisis.
Dot-Com Bubble Burst (2000-2002): Lessons from Speculative Excess
The bursting of the Dot-Com Bubble at the turn of the millennium offers a powerful lesson in speculative excess and sector-specific downturns. During the late 1990s, an explosion of interest in internet-based companies led to enormous valuations for companies with little to no profits. When the bubble finally burst, primarily between 2000 and 2002:
- Sector-Specific Carnage: Technology and telecommunications stocks experienced massive losses, with many internet companies going bankrupt.
- Broader Market Impact: The Nasdaq Composite Index, heavily weighted towards tech, fell by approximately 78% from its peak. The S&P 500 also experienced a bear market, falling by around 50%.
- Economic Aftermath: While not as severe for the broad economy as 2008, the dot-com bust led to a recession and significant job losses in the tech sector.
This event highlighted the dangers of speculative bubbles and the importance of fundamental analysis over hype, offering a contrast to the externally-driven 2020 crash.
Smaller, Sector-Specific Corrections and Bear Markets (e.g., 2022 Tech Sell-off)
It’s also important to remember that not every significant market downturn is a full-blown “crash.” Markets frequently experience corrections and bear markets within specific sectors or asset classes, even if the broader market avoids a full crash. For example:
- 2022 Tech Sell-off: Throughout 2022, rapidly rising inflation and aggressive interest rate hikes by central banks led to a significant bear market for growth stocks, particularly in the technology sector. While the broader S&P 500 entered bear market territory, the focus of the downturn was largely on companies sensitive to higher interest rates and valuation compression, rather than a systemic financial crisis.
- Other Asset Class Declines: Bonds also experienced one of their worst years in decades in 2022, challenging the traditional diversification benefits.
These events underscore that market “crashes” are often broad and rapid, while other downturns can be more targeted, slower, or confined to specific areas of the market.
The Anatomy of a Market Downturn: Warning Signs and Triggers
While no one can predict the exact timing or cause of the next market downturn, history offers clues regarding potential warning signs and common triggers. Vigilance regarding these factors can help investors prepare, though they rarely offer precise foresight.
Economic Indicators and Valuations
Several economic and market indicators have historically preceded significant downturns:
- Inverted Yield Curve: When short-term government bond yields are higher than long-term yields, it’s often seen as a reliable predictor of future recessions and market stress.
- High Valuation Metrics: Elevated price-to-earnings (P/E) ratios, particularly when detached from underlying earnings growth, can signal an overvalued market ripe for a correction.
- Slowing Economic Growth: A slowdown in GDP growth, rising unemployment, and declining corporate profits are fundamental signs of an economy losing momentum, which eventually impacts markets.
- Excessive Leverage: High levels of debt in corporate, household, or government sectors can make the economy more fragile and susceptible to shocks.
Geopolitical Events and Black Swans
Unforeseen, high-impact events – often referred to as “black swans” – can act as potent triggers for market crashes.
- Pandemics: As demonstrated in 2020, global health crises can bring economic activity to a halt and cause rapid market declines.
- Wars and Geopolitical Instability: Major conflicts or severe international tensions can disrupt trade, create uncertainty, and impact commodity prices, leading to market volatility.
- Natural Disasters: Large-scale natural catastrophes can have localized or even broader economic and market impacts depending on their severity and location.
Policy Errors and Regulatory Failures
Government and central bank policies also play a critical role.
- Monetary Policy Errors: Central banks raising interest rates too aggressively, or keeping them too low for too long, can either stifle economic growth or create asset bubbles.
- Fiscal Policy Mismanagement: Unsustainable government debt or poorly designed fiscal policies can erode confidence.
- Regulatory Lapses: As seen with the 2008 crisis, inadequate financial regulation can allow excessive risk-taking to fester and eventually destabilize the system.
Navigating Future Market Volatility: Strategies for Investors
Understanding past crashes is valuable, but its ultimate purpose is to inform future decision-making. Investors cannot avoid market downturns, but they can prepare for them.
Diversification and Asset Allocation
The cornerstone of prudent investing is diversification. Spreading investments across different asset classes (stocks, bonds, real estate, commodities), geographies, and industries helps cushion the blow when one area performs poorly. A well-designed asset allocation strategy, tailored to an individual’s risk tolerance and time horizon, ensures that a portfolio is robust enough to withstand various market conditions.
Long-Term Perspective and Dollar-Cost Averaging
Market crashes are often periods of extreme short-term fear, but for long-term investors, they can present opportunities. Maintaining a long-term perspective – focusing on multi-decade goals rather than quarterly fluctuations – helps avoid panic selling at market lows. Dollar-cost averaging, the strategy of investing a fixed amount of money at regular intervals regardless of market prices, means investors buy more shares when prices are low and fewer when prices are high, often leading to better average returns over time.
Emergency Funds and Financial Preparedness
A robust emergency fund (typically 3-6 months of living expenses in a liquid, easily accessible account) is crucial. This financial safety net prevents investors from being forced to sell investments during a market downturn to cover unexpected expenses or job loss, thereby locking in losses. Overall financial preparedness, including managing debt and having appropriate insurance, strengthens an individual’s resilience during economic shocks.
Emotional Discipline and Avoiding Herd Mentality
Perhaps the most challenging, yet most important, strategy is cultivating emotional discipline. Market crashes thrive on fear and herd mentality. Sticking to a predefined investment plan, rebalancing portfolios objectively, and resisting the urge to follow the crowd (buying high or selling low) are vital. Understanding that market cycles are inevitable – periods of growth are followed by downturns, which are eventually followed by recoveries – empowers investors to view corrections as part of the normal investment landscape, rather than existential threats.
Conclusion
When asking “when was the last market crash?”, the most immediate answer points to the sharp, pandemic-driven decline of March 2020. This event serves as a potent reminder of how quickly markets can react to unforeseen global shocks and how powerful coordinated policy responses can be in stabilizing the financial system. However, looking further back reveals the distinct natures of crashes driven by systemic financial failures (2008) and speculative bubbles (Dot-Com).
Ultimately, market crashes are an inherent, albeit painful, part of the investment cycle. While their causes and characteristics may vary, the lessons learned remain consistent: preparedness, diversification, a long-term perspective, and emotional discipline are the most powerful tools an investor can wield. By understanding the history and anatomy of market downturns, individuals can better navigate future volatility and position themselves for long-term financial success, regardless of when the next market “crash” or significant correction may occur.
aViewFromTheCave is a participant in the Amazon Services LLC Associates Program, an affiliate advertising program designed to provide a means for sites to earn advertising fees by advertising and linking to Amazon.com. Amazon, the Amazon logo, AmazonSupply, and the AmazonSupply logo are trademarks of Amazon.com, Inc. or its affiliates. As an Amazon Associate we earn affiliate commissions from qualifying purchases.