The question “what will the stock market do today?” is perhaps the most frequently asked inquiry in the world of finance. Every morning, as the sun rises over Wall Street, millions of investors, from institutional hedge fund managers to retail day traders, scramble to interpret a sea of data, news, and signals. Predicting the movement of the stock market over a single six-and-a-half-hour trading session is notoriously difficult, yet understanding the variables that influence daily price action is essential for anyone looking to navigate the complexities of personal finance and investing.
Daily market fluctuations are rarely the result of a single event. Instead, they are the product of a complex interplay between macroeconomic data, corporate performance, and human psychology. To answer what the market will do today, one must look beyond the ticker tape and analyze the underlying forces that dictate whether the bulls or the bears will control the narrative.
The Macroeconomic Drivers of Daily Market Movements
The primary engine behind daily market volatility is the release of macroeconomic data. These reports act as a pulse check for the health of the economy, and when the results deviate from analyst expectations, the market reacts—often violently.
Interest Rates and Federal Reserve Policy
The Federal Reserve is arguably the most influential entity in the global financial markets. Any “Fed speak” or official policy announcement regarding the federal funds rate can cause immediate shifts in stock prices. High interest rates generally make borrowing more expensive for companies, which can compress profit margins and slow growth. If the market anticipates a “hawkish” tone (indicating potential rate hikes), stocks often retreat. Conversely, a “dovish” tone (suggesting rate cuts or stability) can trigger a relief rally.
Inflation Data and Economic Indicators
Reports such as the Consumer Price Index (CPI) and the Producer Price Index (PPI) are vital benchmarks. If inflation comes in higher than expected, the market fears that the Fed will raise rates to cool the economy, leading to a sell-off. Other indicators, such as the monthly Non-Farm Payrolls (NFP) report, provide insight into the labor market. A cooling labor market might suggest a slowing economy, while an overheated one could signal persistent inflation.
Geopolitical Events and Global Stability
We live in a hyper-connected global economy. A political crisis in Europe, a trade dispute in Asia, or a conflict in the Middle East can impact commodity prices and supply chains instantly. For example, a spike in oil prices due to geopolitical tension can lead to concerns about rising transportation costs, affecting everything from retail stocks to airline equities in a single trading session.
Technical Analysis: Reading the Pulse of the Tape
While fundamental news tells us why the market might move, technical analysis tells us where it is likely to go. Many traders ignore the “noise” of the news cycle and focus exclusively on price action and historical patterns.
Support and Resistance Levels
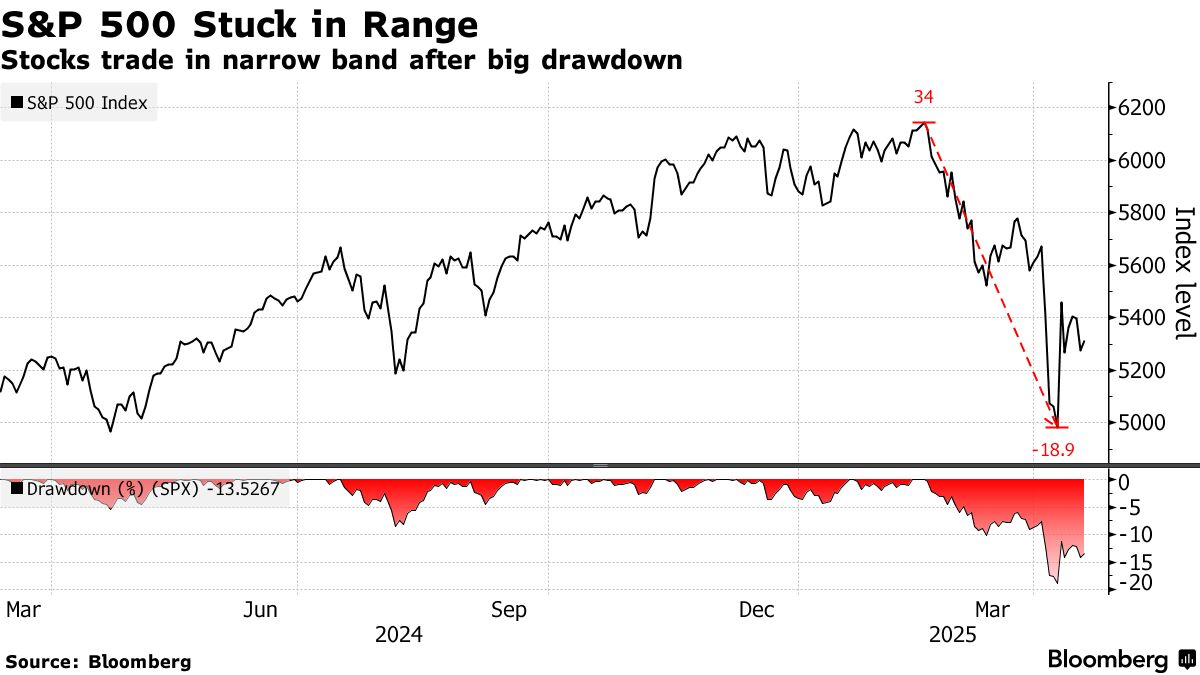
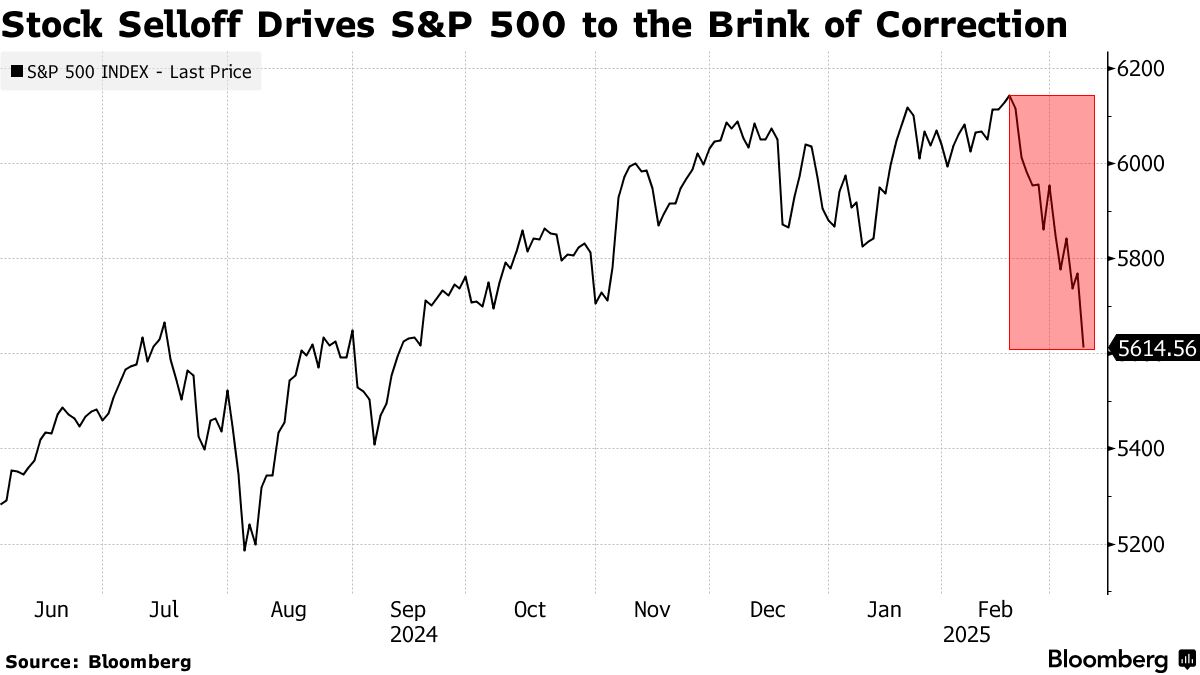
Technical analysts look for specific price points where a stock or index has historically struggled to fall below (support) or rise above (resistance). If the S&P 500 is approaching a major psychological resistance level, such as a round number or a previous all-time high, selling pressure often increases. Conversely, if the market “holds” a support level, it provides a foundation for a daily bounce.
Moving Averages and Trend Indicators
The 50-day and 200-day moving averages are two of the most watched metrics in the financial world. When the market is trading above these averages, the sentiment is generally bullish. If an index drops below its 200-day moving average, it can trigger automated sell orders from institutional algorithms, leading to a sharp daily decline. Identifying whether the “trend is your friend” is a cornerstone of daily market forecasting.
The Role of Volume and Sentiment Analysis
Volume is the fuel of the market. A price move on low volume is often seen as a “fake-out,” whereas a move on high volume indicates strong conviction among participants. Additionally, sentiment gauges like the CBOE Volatility Index (VIX), often called the “Fear Gauge,” provide clues about market anxiety. A rising VIX usually correlates with a falling stock market, as investors buy “insurance” through put options.
Earnings Season and Corporate Catalysts
Four times a year, the market enters “Earnings Season,” a period where the daily direction of the market is largely dictated by corporate balance sheets. This is the time when the theoretical value of a company meets the reality of its performance.
Quarterly Reports and Forward Guidance
When a “mega-cap” company like Apple, Microsoft, or NVIDIA releases its quarterly results, the impact is felt far beyond its own stock price. Because these companies carry so much weight in major indices, their performance can pull the entire market up or down. Investors look at two things: the “beat” (did they earn more than expected?) and the “guidance” (what do they expect for the next quarter?). A company can report record profits, but if their outlook for the future is dim, the stock will likely plummet today.
Sector-Specific Momentum
The market is often divided into sectors, such as Tech, Healthcare, Energy, and Financials. On any given day, “sector rotation” may occur. If interest rates are rising, investors might rotate out of growth-oriented tech stocks and into “value” sectors like banking or utilities. Understanding which sector is leading or lagging helps clarify why the Dow Jones might be up while the Nasdaq is down.
Institutional Rebalancing and Large-Scale Trades
At the end of months or quarters, large institutional funds often rebalance their portfolios to maintain specific asset allocations. This can lead to massive “buy” or “sell” programs in the final hour of trading. These moves aren’t always based on news; they are structural requirements of the fund, but they can significantly influence the market’s closing direction.
Behavioral Finance: The Psychology of Today’s Market
The stock market is not just a collection of numbers; it is a collection of human emotions. Behavioral finance studies how fear and greed drive daily price action, often leading to irrational market movements.
The Impact of “Fear and Greed” Cycles
When the market is in a state of euphoria, investors often ignore bad news, leading to “overbought” conditions. This is where FOMO (Fear of Missing Out) takes over, and prices climb despite weak fundamentals. On the other hand, during a panic, “capitulation” occurs. This is the point where investors sell at any price just to stop the pain, often marking a daily or short-term bottom.
Algorithmic Trading and High-Frequency Volatility
In the modern era, over 70% of trading volume is estimated to be executed by algorithms. These “black box” systems trade in milliseconds, responding to headlines or price breaks faster than any human could. This can lead to “flash crashes” or rapid spikes that seem to come out of nowhere. Understanding that the market’s daily movement is often a “math problem” being solved by computers helps investors stay calm during periods of intraday turbulence.
Strategies for Navigating Daily Market Uncertainty
So, what should an investor do when faced with the question of what the market will do today? For the long-term investor, the answer is often “very little.” However, for those managing active portfolios, a structured approach is necessary.
Risk Management and Stop-Loss Orders
The first rule of daily trading is capital preservation. No matter how certain a “bullish” setup looks, the market can always surprise you. Using stop-loss orders—automated instructions to sell a security when it reaches a certain price—helps mitigate the damage of an unexpected market downturn. Managing the “downside” is more important than chasing the “upside.”
Distinguishing Between Noise and Long-Term Trends
It is easy to get caught up in the “noise” of daily headlines. A single tweet or a minor economic data point can cause a 1% swing in the market, but in the grand scheme of a ten-year investment horizon, that swing is irrelevant. Successful investors learn to distinguish between “market noise” and “structural changes.” A structural change might be a shift in central bank policy, whereas noise is a temporary reaction to a political rumor.
The Importance of a Trading Plan
To survive the daily volatility of the stock market, one must have a plan before the opening bell rings. This includes knowing your entry points, your exit targets, and your risk tolerance. Watching the market without a plan is like sailing a ship without a compass; you are at the mercy of the waves. By understanding the macroeconomic, technical, and psychological factors at play, you can approach each trading day with clarity rather than confusion.
In conclusion, what the stock market does today is a reflection of the collective expectations, fears, and reactions of millions of participants. While no one has a crystal ball, by monitoring interest rates, technical support levels, corporate earnings, and investor sentiment, you can gain a significant edge. The market is a weighing machine in the long run, but in the short run—on a day like today—it is a voting machine, recording the shifting moods of the global financial community.
aViewFromTheCave is a participant in the Amazon Services LLC Associates Program, an affiliate advertising program designed to provide a means for sites to earn advertising fees by advertising and linking to Amazon.com. Amazon, the Amazon logo, AmazonSupply, and the AmazonSupply logo are trademarks of Amazon.com, Inc. or its affiliates. As an Amazon Associate we earn affiliate commissions from qualifying purchases.