The question of what percent of taxes the top 1% pay is a recurring flashpoint in economic discourse, political debates, and public perception. It’s a statistic often cited to support arguments about fairness, wealth distribution, and the structure of tax systems. However, understanding this figure requires more than a simple percentage; it demands a deep dive into definitions, methodologies, and the intricate dynamics of tax policy. For individuals interested in personal finance, business finance, or simply understanding the broader economic landscape, dissecting this question is crucial. It sheds light on how national budgets are funded, who bears the primary financial responsibility, and the ongoing tension between progressivity, economic efficiency, and social equity.
At its core, the debate hinges on a perception gap: some believe the wealthy don’t pay their fair share, while others argue they disproportionately shoulder the nation’s tax burden. Both perspectives often draw on specific data points, but a holistic view reveals a complex picture painted by various types of taxes, different income sources, and the ever-evolving nature of tax codes. This article will unpack the intricacies of top 1% taxation, explore the different ways their contributions are measured, and discuss the broader implications for both individuals and the economy at large, all within the exclusive domain of financial understanding.
Demystifying the “Top 1%” – Who Are They?
Before delving into tax percentages, it’s essential to understand who exactly constitutes the “top 1%.” This group is often conceptualized as a monolithic bloc of ultra-wealthy individuals, but in reality, it’s a dynamic and diverse cohort defined primarily by income thresholds, which fluctuate annually and vary geographically.
Defining the Threshold
The “top 1%” is typically defined by annual income. The exact income threshold required to be considered part of the top 1% in the United States, for example, changes each year with economic growth and inflation. According to recent data from organizations like the IRS and the Economic Policy Institute, this threshold generally hovers around $600,000 to $900,000 in adjusted gross income (AGI) for a household, though some analyses may place it higher depending on the specific dataset and methodology. It’s important to note that this is a moving target, constantly influenced by economic performance, wages, and investment returns. Belonging to this group for one year does not guarantee inclusion in subsequent years, as business cycles and personal circumstances can shift an individual’s or household’s income dramatically.
Income vs. Wealth
A critical distinction must be made between income and wealth. While the top 1% income earners are certainly affluent, they are not necessarily the same as the top 1% wealth holders. Wealth refers to accumulated assets (real estate, stocks, bonds, businesses) minus liabilities (debts), representing a person’s total net worth. Income is the flow of money received over a period. Many individuals in the top 1% income bracket are high-earning professionals (doctors, lawyers, executives) who may have substantial income but are still actively accumulating wealth. The truly wealthiest individuals, often with multi-million or even multi-billion dollar net worths, typically derive a significant portion of their income from capital gains, dividends, and other investment returns rather than just salaries. This distinction is crucial for understanding tax burdens, as different types of income are taxed differently.
A Dynamic Group
The composition of the top 1% is far from static. Studies on income mobility have shown that individuals and households can move in and out of this top bracket over time. Entrepreneurial success, career progression, or a lucrative year for investments can elevate someone into the top 1%, while retirement, business setbacks, or market downturns can cause others to exit. This fluidity challenges the notion of a fixed “elite” and underscores the importance of examining tax policy not just on annual snapshots but also over longer economic cycles and individual lifespans. The dynamic nature of this group also means that tax reforms can have varying impacts on different segments within the top 1%, further complicating the policy discussion.
Unpacking the Tax Burden: Progressive vs. Regressive Systems
Understanding the tax contributions of the top 1% requires examining the various taxes they pay and the nature of the tax system itself. Most modern economies employ a mix of progressive, regressive, and proportional taxes, each impacting different income brackets differently.
Income Tax Contributions
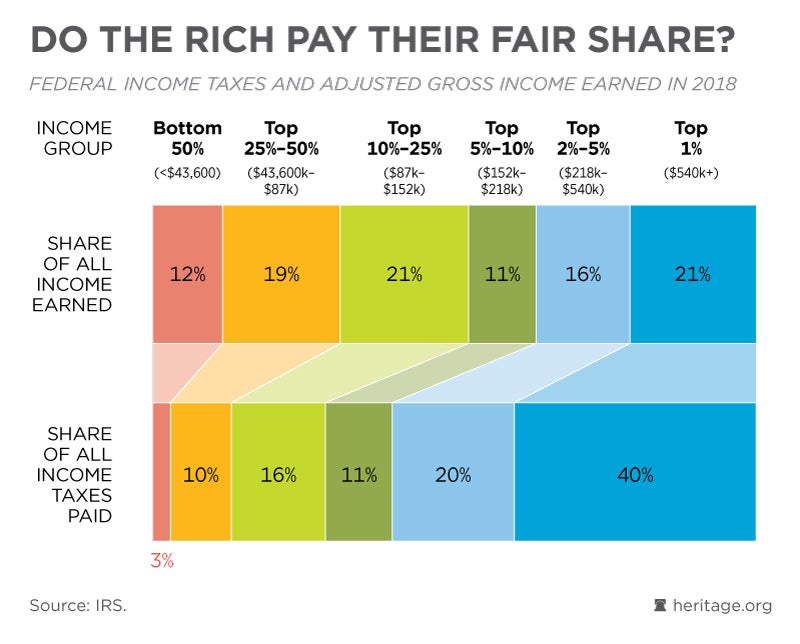
In many developed countries, the personal income tax system is progressive, meaning higher earners pay a larger percentage of their income in taxes. When looking specifically at federal income taxes, data consistently shows that the top 1% of income earners contribute a disproportionately large share. For instance, according to IRS data, the top 1% of income earners in the U.S. frequently pay over 40% of all federal income taxes collected, while earning around 20-25% of the total income. This seemingly large contribution is a direct result of the progressive tax brackets, where marginal rates increase with income, and the sheer volume of income concentrated at the top. This effectively means that while they pay a high percentage of all income taxes, their effective tax rate (total taxes paid divided by total income) can be a point of contention when considering all forms of income and deductions.
Other Federal Taxes (Payroll, Capital Gains)
While income tax is a significant component, it’s not the only tax wealthy individuals pay. Payroll taxes (Social Security and Medicare) are generally regressive up to a certain income cap for Social Security, meaning lower and middle-income earners pay a larger percentage of their income towards these taxes up to the cap. High-income earners, especially those with incomes far exceeding the Social Security wage base limit, pay a smaller percentage of their total income in payroll taxes, as their income above the cap is not subject to Social Security tax, although they still pay Medicare taxes on all earned income.
Capital gains taxes, on the other hand, are particularly relevant to the top 1%. A substantial portion of their income often comes from investments (selling stocks, real estate, etc.) rather than wages. Capital gains are typically taxed at lower rates than ordinary income, especially for long-term holdings. This preferential treatment for capital gains is a significant policy choice that can reduce the overall effective tax rate for individuals with substantial investment income, a characteristic feature of the very wealthy. This often leads to debates about fairness and whether these lower rates incentivize investment or simply favor the rich.
State and Local Tax Variances
The picture becomes even more complex when considering state and local taxes. These can include state income taxes, sales taxes, and property taxes. State income tax rates vary wildly across the U.S., with some states having no income tax at all, while others have highly progressive systems. Sales taxes are generally regressive, disproportionately affecting lower-income individuals who spend a larger percentage of their income on consumption. Property taxes can also be regressive or progressive depending on local assessment practices and whether homeowners receive exemptions or deductions. The aggregate impact of these varied state and local taxes on the top 1% compared to other income groups can significantly alter the overall tax burden distribution, often making the total tax picture less progressive than federal income tax data alone suggests.
The Nuance of Effective vs. Statutory Tax Rates
One of the most contentious aspects of the debate around the top 1%’s tax contributions is the difference between statutory tax rates and effective tax rates. While statutory rates are the official rates set by law, effective rates are what individuals actually pay after factoring in all deductions, exemptions, credits, and preferential tax treatments.

Loopholes and Deductions
The U.S. tax code, like many others globally, is incredibly complex, filled with numerous deductions, credits, and allowances. While many of these provisions are designed to encourage specific behaviors (e.g., charitable giving, homeownership, business investment), they can also be utilized more effectively by high-income earners who have access to sophisticated financial planning and tax advisory services. Business expenses, depreciation write-offs, tax-advantaged retirement accounts, and various other legitimate deductions can significantly reduce taxable income, leading to a lower effective tax rate than the statutory rate might suggest. This is often what critics refer to when they speak of “loopholes,” even if these are legally permissible provisions within the tax code.
The Role of Capital Gains
As mentioned, capital gains play a critical role. Long-term capital gains are taxed at rates significantly lower than ordinary income tax rates, particularly for high-income earners. For example, in the U.S., the top long-term capital gains tax rate is often 15% or 20%, whereas the top ordinary income tax rate can exceed 37%. For individuals whose primary source of income is from the sale of assets (stocks, real estate, businesses), this preferential treatment can dramatically lower their effective tax rate compared to someone earning the same amount primarily through wages. This structure is often justified as a means to encourage investment and economic growth, but it undeniably contributes to lower effective tax rates for the wealthy, who disproportionately benefit from capital income.
Philanthropy and Tax Incentives
High-net-worth individuals often engage in significant charitable giving. The tax code provides incentives for this philanthropy, allowing deductions for donations to qualified charities. While this encourages beneficial societal contributions, it also means that a portion of the income that might otherwise be taxed is effectively redirected to charitable causes, further reducing taxable income. Moreover, complex strategies involving trusts and foundations can be used to manage wealth transfer and reduce estate taxes, which can also influence the perceived and actual tax burden of the wealthy over generations. These mechanisms, while legal and often socially beneficial, contribute to the complexity of accurately assessing the true tax contributions and wealth distribution dynamics.
Economic Implications and Societal Debate
The discussion surrounding the tax contributions of the top 1% extends far beyond mere percentages; it delves into fundamental questions about economic efficiency, social justice, and the role of government.
Funding Public Services
The taxes paid by the top 1% are a substantial source of revenue for government budgets. This revenue is critical for funding public services such as infrastructure, education, healthcare, defense, and social safety nets. When the top 1% contributes a significant portion of income tax revenue, it means that a large segment of the national budget relies on the economic performance and tax compliance of a relatively small group of taxpayers. This concentration of revenue responsibility can lead to debates about economic stability, particularly if policy changes or economic downturns disproportionately affect the income or investment returns of this group.
Wealth Inequality and Social Equity
One of the central themes in the debate is wealth inequality. Critics argue that despite paying a large share of income taxes, the overall tax system (including payroll, sales, and capital gains taxes) might not sufficiently address the widening gap between the rich and the rest. They contend that lower capital gains rates, various deductions, and the regressive nature of some taxes mean the very wealthy often pay a lower effective overall tax rate than some middle-class households when all taxes are considered as a percentage of their total wealth or income. This perspective often frames the issue as one of social equity, suggesting that the tax system could be reformed to achieve a more equitable distribution of wealth and opportunities.
Economic Growth and Investment
Conversely, proponents of lower taxes for the wealthy often argue that high marginal tax rates on income and capital gains can stifle economic growth and investment. They suggest that taxing the wealthy too heavily reduces their incentive to work, innovate, invest, and create jobs. According to this view, the wealthy are often job creators and investors whose capital fuels economic expansion. Lower tax burdens, particularly on capital, are seen as a way to encourage them to reinvest their wealth into productive enterprises, ultimately benefiting everyone through economic dynamism and increased prosperity. This perspective often highlights the risk-taking and entrepreneurial spirit attributed to those who accumulate significant wealth.
Policy Perspectives and Future Directions
The ongoing dialogue about the top 1%’s tax contributions inevitably leads to proposals for reform and differing visions for the future of tax policy. These discussions are critical for policymakers and citizens alike in shaping a financial framework that balances various economic and social objectives.
Proposals for Tax Reform
Policy discussions frequently include proposals to alter the tax burden on the top 1%. These proposals often fall into several categories:
- Increasing Top Marginal Income Tax Rates: Advocates for greater progressivity suggest raising the highest income tax brackets to capture more revenue from the wealthiest individuals.
- Equalizing Capital Gains and Ordinary Income Tax Rates: A common proposal is to tax long-term capital gains at the same rates as ordinary income, arguing that this would eliminate a significant tax advantage for the wealthy and make the system fairer.
- Implementing a Wealth Tax: Some economists and politicians have proposed a wealth tax, where a percentage of an individual’s total net worth above a certain threshold would be taxed annually. This is a more radical proposal designed to directly address wealth inequality rather than just income.
- Closing “Loopholes” and Enhancing Enforcement: Efforts to simplify the tax code, eliminate specific deductions or credits disproportionately benefiting the wealthy, and increase IRS enforcement are also frequently discussed as ways to ensure everyone pays their fair share.
- Reforming Estate Taxes: Adjustments to estate and inheritance taxes, which apply to wealth passed down after death, are also debated as a means to address intergenerational wealth transfer and inequality.
The Global Context
It’s also important to view the taxation of the top 1% within a global context. Different countries employ vastly different tax systems, with varying rates for income, capital gains, and wealth. International comparisons often influence domestic policy debates, as countries compete for mobile capital and highly skilled individuals. Tax havens and international tax evasion strategies further complicate the picture, as wealth can be moved across borders to minimize tax liabilities. Understanding global trends and the efforts towards international tax cooperation is essential for any comprehensive discussion on taxing the wealthy.

Striking a Balance
Ultimately, the challenge for policymakers is to strike a balance between several often-competing objectives: generating sufficient government revenue, promoting economic growth and investment, maintaining fairness and progressivity, and simplifying the tax code. There is no universally agreed-upon “correct” percentage for the top 1% to pay, as societal values and economic priorities differ. The ongoing debate about what percent of taxes the top 1% pays is a reflection of these broader societal choices about how wealth is created, distributed, and ultimately, how a nation funds its collective future. For those managing personal and business finances, keeping an eye on these policy discussions is not just an academic exercise but a practical necessity for anticipating future financial landscapes and planning accordingly.