Understanding the movement of money is the cornerstone of financial literacy. Whether you are tracking the performance of a stock portfolio, managing a household budget, or overseeing a corporate balance sheet, numbers rarely stay static. They fluctuate, and more often than we would like, they trend downward. However, a “decrease” is only a vague observation until it is quantified. Knowing exactly how to work out a percentage decrease allows you to move beyond gut feelings and into the realm of precise financial analysis.
In the world of money, percentages are the universal language of comparison. They allow an investor to compare a $500 loss on a $10,000 investment with a $50 loss on a $500 investment, revealing that while the dollar amounts differ, the impact is identical. This guide will walk you through the fundamental mechanics of calculating percentage decrease and, more importantly, how to apply this logic to optimize your financial health.

The Fundamental Formula of Financial Decline
Before applying math to complex investment strategies, one must master the basic arithmetic. A percentage decrease represents the relationship between a starting value and a reduced ending value, expressed as a portion of the original amount.
Understanding the “Old vs. New” Dynamic
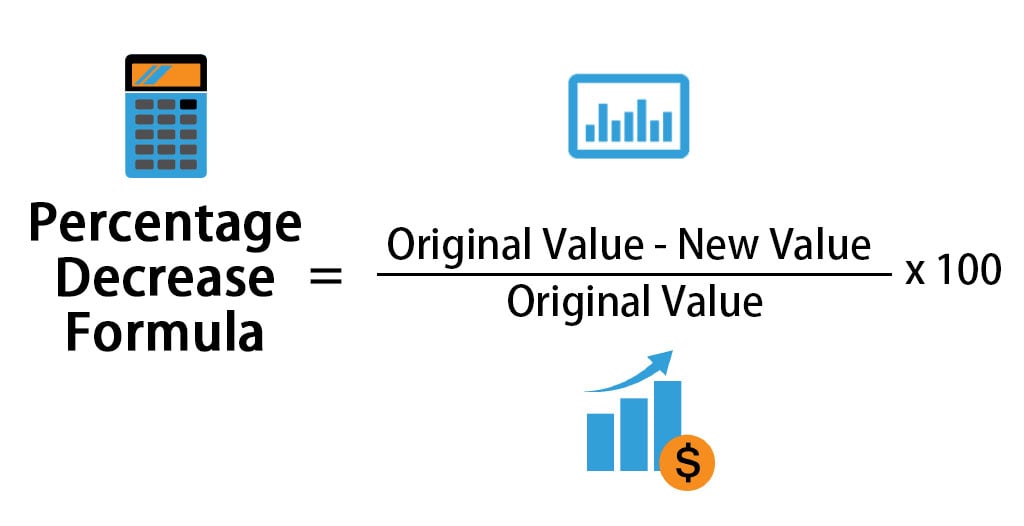
In financial terms, we often refer to the “Original Value” (what you started with) and the “New Value” (what remains after a decline). The percentage decrease tells you what portion of the original capital has been lost. It is vital to remember that in this specific calculation, the denominator—the number you divide by—is always the original value. This is because we are measuring the “hole” left in the initial amount.
If you bought a cryptocurrency for $1,000 and it is now worth $750, your “Old Value” is $1,000 and your “New Value” is $750. The decrease is $250. To understand the significance of that $250, you must view it in the context of the $1,000 you originally risked.
The Step-by-Step Calculation Process
Calculating the percentage decrease involves three simple steps:
- Find the Difference: Subtract the New Value from the Original Value. (Original – New = Decrease).
- Divide by the Source: Divide the decrease by the Original Value. (Decrease / Original = Decimal).
- Convert to Percentage: Multiply the resulting decimal by 100 to find the percentage.
Example:
- Step 1: $1,000 – $750 = $250.
- Step 2: $250 / $1,000 = 0.25.
- Step 3: 0.25 * 100 = 25%.
Your investment has seen a 25% decrease. In professional finance, this is often the first metric reported during quarterly reviews because it provides immediate context regarding the severity of a loss.
Percentage Decrease in Personal Finance and Budgeting
For the average individual, the most frequent application of this math occurs within the monthly budget. Mastering this calculation helps you track the effectiveness of your cost-cutting measures and understand the eroding effects of inflation on your purchasing power.
Cutting Expenses and Cost Savings Analysis
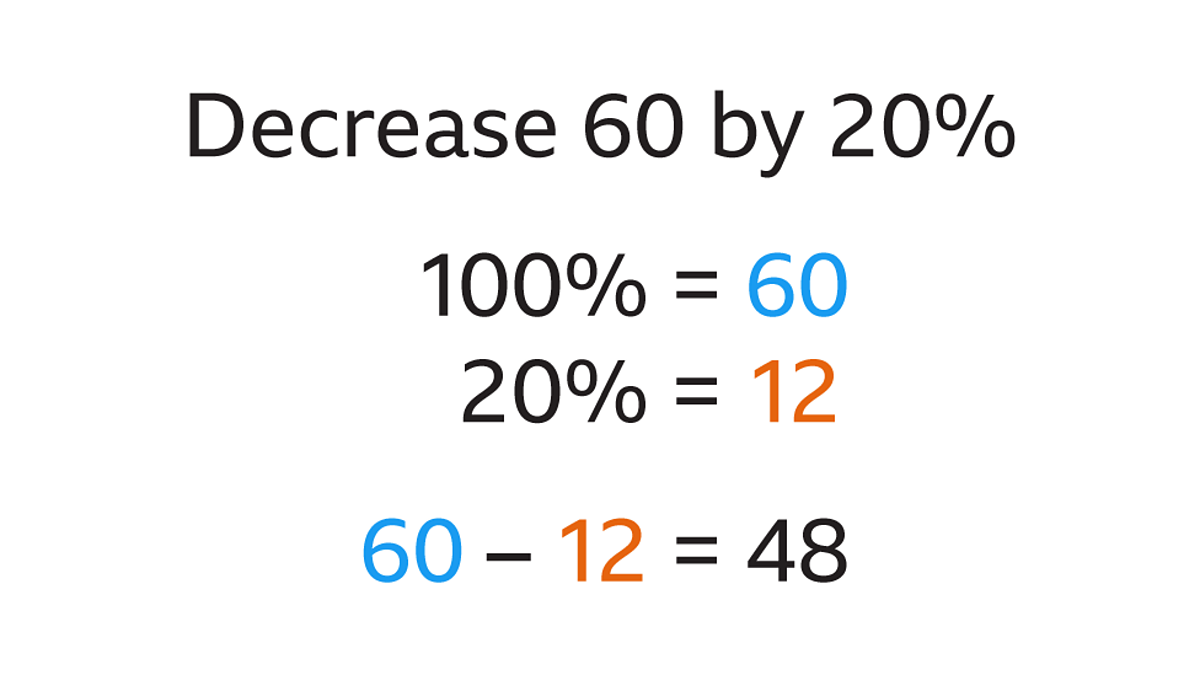
When you set a goal to “spend less,” the percentage decrease formula becomes your primary tool for tracking success. If your monthly utility bill was $200 in January and you implemented energy-saving habits that brought the bill down to $160 in February, you have achieved a 20% decrease.
This is more than just a “win”; it is a metric for efficiency. By identifying which categories of your budget show the highest percentage decrease, you can determine where your efforts are yielding the best results. A 5% decrease in a large expense (like a $2,000 rent payment) is often more impactful than a 50% decrease in a small expense (like a $10 streaming subscription). Using the formula helps you prioritize your financial energy.
Inflation and Purchasing Power
Money is not a fixed unit of value; its power changes over time. While we usually talk about inflation as a “percentage increase” in prices, it can also be viewed as a “percentage decrease” in the purchasing power of your cash.
If $1.00 bought a loaf of bread last year, but that same loaf now costs $1.10, the value of your dollar has decreased relative to that asset. Financial planners use percentage decrease calculations to show clients how much “real” value their savings might lose if left in a low-interest bank account. Understanding this mathematical reality is often the catalyst that moves people from being “savers” to being “investors.”
Investment Performance: Analyzing Portfolio Drawdowns
In the niche of investing, the term “drawdown” is frequently used to describe the percentage decrease from a peak value to a trough. Understanding these numbers is essential for managing risk and maintaining emotional discipline during market volatility.
Understanding Market Volatility and Loss Recovery
The most dangerous part of a percentage decrease in investing is how it impacts your ability to recover. Many novice investors fall into the trap of thinking that a 20% loss can be fixed with a 20% gain. Mathematically, this is incorrect.
If you have $100 and lose 20%, you are down to $80. To get back to $100, you need to gain $20. However, $20 is not 20% of your new $80 balance—it is 25%. Therefore, a 20% decrease requires a 25% increase just to break even. This is known as “mathematical asymmetry,” and it is why seasoned investors focus so heavily on minimizing percentage decreases (downside protection).
The Asymmetry of Percentage Gains and Losses
The further a value drops, the more “work” the remaining money has to do to recover.
- A 10% decrease requires an 11.1% gain to recover.
- A 25% decrease requires a 33.3% gain to recover.
- A 50% decrease requires a 100% gain to recover.
- A 90% decrease requires a 900% gain to recover.
By calculating the percentage decrease of your assets during a market downturn, you gain a realistic perspective on the steepness of the mountain you have to climb to reach your previous high-water mark. This logic encourages more conservative capital allocation and the use of “stop-loss” orders to prevent minor decreases from turning into catastrophic ones.
Business Finance: Revenue Trends and Profit Margins
For business owners and financial analysts, percentage decrease is a Key Performance Indicator (KPI). It is used to signal trouble in revenue streams or to celebrate a reduction in overhead costs.
Monitoring Year-over-Year (YoY) Performance
Business health is rarely judged in a vacuum; it is judged against previous performance. If a company earned $1.2 million in Q3 of last year but only $1 million in Q3 of this year, they are facing a 16.6% decrease in quarterly revenue.
Analysts use this percentage to determine if the decline is a seasonal fluke or a systemic issue. A small percentage decrease might be ignored as “market noise,” but a double-digit decrease usually triggers a strategic pivot or a round of cost-cutting. By standardizing these changes as percentages, businesses can compare the performance of different departments, even if those departments have vastly different budgets.
Identifying Red Flags in Corporate Cash Flow
Percentage decrease is also an essential tool for “burn rate” analysis in startups. If a company’s cash reserves are decreasing by 15% every month, a financial officer can accurately predict the “runway”—the amount of time left before the company runs out of money.
Furthermore, calculating the percentage decrease in “cost of goods sold” (COGS) can indicate improving operational efficiency. If a manufacturer finds a cheaper supplier and reduces their production cost per unit from $50 to $42.50, they have achieved a 15% decrease in costs. This percentage directly translates into a higher profit margin, showcasing how a decrease in one area (expenses) leads to an increase in another (profit).
Using Financial Tools to Automate the Math
While knowing the manual formula is vital for conceptual understanding, the modern financial world relies on technology to handle these calculations at scale.
Spreadsheet Functions for Fiscal Analysis
Whether you use Microsoft Excel or Google Sheets, the software is designed to handle percentage changes across thousands of data points instantly. To calculate percentage decrease in a spreadsheet, you would typically use a formula like: = (A1 - B1) / A1.
By setting the cell format to “Percentage,” the software handles the multiplication by 100 for you. This allows investors to track entire portfolios of dozens of stocks and see the real-time percentage decrease of each asset relative to its “cost basis” (the price at which it was bought).
Online Calculators for Quick Decision Making
In fast-moving financial environments—such as a real estate auction or a high-frequency trading scenario—manual calculation might be too slow. Various financial tools and mobile apps offer “Percent Change” calculators where you simply input the “From” and “To” numbers.
However, even when using these tools, the underlying financial logic remains the same. The tool is simply a faster way to apply the “Old vs. New” principle. Relying on these tools for quick comparisons can help you decide in seconds whether a “discounted” price on a business asset is actually a good deal or just a marketing gimmick.
Conclusion: The Power of Quantitative Awareness
In finance, what isn’t measured cannot be managed. Learning how to work out a percentage decrease is more than a simple math trick; it is a fundamental shift in how you perceive value. It moves you away from the emotional volatility of seeing “the numbers go down” and toward a professional, analytical approach to wealth management.
By applying this formula to your personal budget, your investment portfolio, and your business ventures, you gain the ability to spot trends early, protect your capital from asymmetric losses, and make data-driven decisions. Whether you are navigating a bear market or simply trying to lower your monthly grocery bill, the percentage decrease is your most reliable metric for measuring progress and identifying risks in the complex world of money.
aViewFromTheCave is a participant in the Amazon Services LLC Associates Program, an affiliate advertising program designed to provide a means for sites to earn advertising fees by advertising and linking to Amazon.com. Amazon, the Amazon logo, AmazonSupply, and the AmazonSupply logo are trademarks of Amazon.com, Inc. or its affiliates. As an Amazon Associate we earn affiliate commissions from qualifying purchases.