Inflation is often described as the “silent thief” of the financial world. It is the gradual decline of purchasing power, reflected in the rise of prices across an economy over time. For the individual investor, the business owner, or the household budgeter, understanding how to find, measure, and interpret inflation is not merely an academic exercise—it is a fundamental necessity for financial survival. While the headlines often shout a single percentage point, the reality of inflation is multifaceted, affecting different sectors and individuals in vastly different ways.
To navigate this landscape, one must look beyond the evening news. Finding inflation requires a deep dive into official government data, an understanding of personal spending patterns, and a keen eye for the subtle ways the market hides rising costs. This guide provides a roadmap for identifying inflation at both the macro and micro levels, offering the tools needed to protect your wealth in an inflationary environment.
The Macro View: Decoding Official Inflation Reports
The first step in finding inflation is looking at the aggregate data provided by government agencies. These institutions track thousands of prices to provide a standardized metric of how much the cost of living is increasing. While these figures are “averages,” they serve as the primary benchmark for central bank policy and interest rate adjustments.
The Consumer Price Index (CPI)
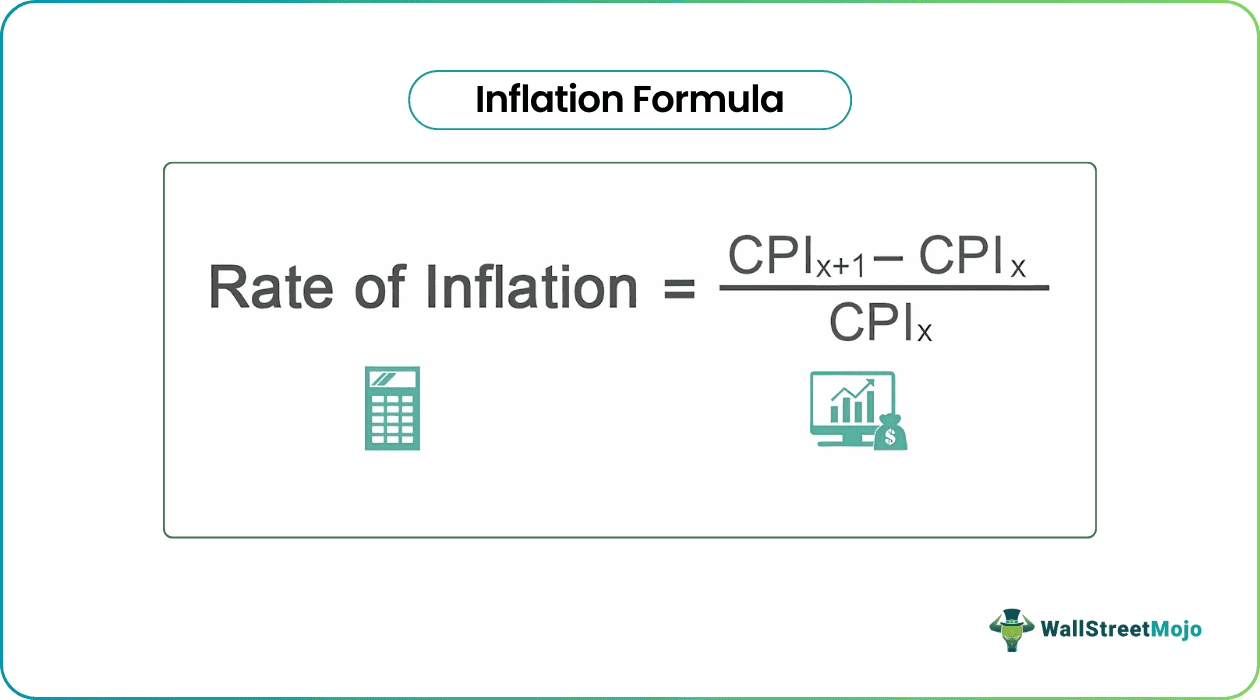
The Consumer Price Index (CPI) is the most widely recognized measure of inflation. Produced monthly by the Bureau of Labor Statistics (BLS), the CPI measures the change in prices paid by consumers for a representative “basket” of goods and services. This basket includes everything from milk and gasoline to rent and medical care.
When looking for inflation in the CPI report, it is important to distinguish between “Headline CPI” and “Core CPI.” Headline CPI includes all items, whereas Core CPI strips out the volatile categories of food and energy. Economists often prefer Core CPI because it provides a clearer picture of long-term inflationary trends, as food and gas prices can fluctuate wildly due to temporary supply shocks or geopolitical events.
Personal Consumption Expenditures (PCE)
While the CPI is the most famous, the Federal Reserve—the central bank of the United States—actually prefers the Personal Consumption Expenditures (PCE) price index. The PCE is published by the Bureau of Economic Analysis (BEA).
The primary difference lies in the methodology. The PCE is more dynamic; it accounts for “substitution effects.” For example, if the price of beef rises significantly and consumers start buying more chicken instead, the PCE adjusts its weighting to reflect that change in behavior. Finding inflation through the PCE often provides a more realistic view of how consumers are actually spending their money in response to price hikes.
Utilizing the FRED Database
For those who want to find inflation data firsthand rather than waiting for a news summary, the Federal Reserve Economic Data (FRED) database is an invaluable tool. Managed by the Federal Reserve Bank of St. Louis, FRED offers thousands of time-series data points. Users can search for “CPIAUCSL” (CPI for All Urban Consumers) or “PCEPI” (PCE Price Index) to generate custom charts, compare historical cycles, and see exactly when inflationary spikes began. This level of granular access allows investors to spot trends before they become mainstream talking points.
The Micro View: Calculating Your Personal Inflation Rate
The biggest criticism of official inflation data is that it rarely reflects the experience of an individual household. If the CPI says inflation is 3%, but your rent went up 10% and your child’s tuition rose 15%, your personal inflation rate is much higher than the national average. Finding your personal inflation rate is essential for accurate financial planning and retirement forecasting.
Building Your Personal Basket of Goods
To find your unique inflation rate, you must create your own “basket of goods” based on your actual spending. Start by categorizing your expenses over the last 12 months. Major categories usually include housing (mortgage or rent), transportation (fuel, insurance, maintenance), food (groceries and dining out), healthcare, and discretionary spending.
By comparing what you paid for these specific items a year ago versus what you pay today, you can calculate your personal percentage increase. For many, housing and healthcare carry a much heavier weight in their personal basket than they do in the official CPI, which can lead to a significant discrepancy between “official” inflation and “real-world” costs.
Digital Tools for Real-Time Tracking
Tracking every penny manually is tedious, but modern financial technology has made it easier to find inflation in your own budget. Using apps like YNAB (You Need A Budget), Monarch Money, or specialized spreadsheets allows you to tag expenses and monitor price increases over time.
By reviewing your “Cost Per Unit” for recurring purchases—such as the price per gallon of gas or the monthly cost of a specific subscription—you can identify exactly where your purchasing power is being eroded. This data-driven approach allows you to make informed decisions about where to cut back or where to reallocate funds to maintain your lifestyle.

The Impact of Lifecycle and Geography
Inflation is not geographically uniform. Finding inflation often involves looking at where you live and what stage of life you are in. A retiree in Florida may experience inflation primarily through rising healthcare and insurance costs, while a young professional in New York City may feel it through rent and public transportation hikes. When analyzing your financial health, consider these external factors that official reports might overlook.
Subtle Inflation: Identifying Shrinkflation and Skimpflation
Not all inflation shows up as a higher price tag on a shelf. Companies often use psychological pricing tactics to hide rising costs from consumers. If you want to find the “true” rate of inflation, you have to look closer at the products themselves.
The Rise of Shrinkflation
Shrinkflation occurs when a company maintains the price of a product but reduces the quantity or size. You might pay the same $5.00 for a bag of potato chips, but the bag now contains 9 ounces instead of 10. Technically, the price per unit has increased by 11%, even though the “sticker price” remained the same.
To find shrinkflation, consumers should pay attention to the “unit price” (e.g., price per ounce or price per liter) displayed on grocery store shelves rather than the total price. This is the most honest metric of value and the most accurate way to detect hidden inflationary pressure in the retail sector.
Skimpflation and Service Decay
A more insidious form of inflation is “skimpflation.” This happens when a company reduces the quality of a service or product to save money, rather than raising the price. Examples include a hotel removing daily housekeeping, a restaurant using cheaper ingredients, or a software company reducing its customer support staff.
While skimpflation is harder to quantify than a price hike, it represents a genuine loss of value. When you pay the same amount for a diminished experience, your money is effectively worth less. Identifying these trends is crucial for businesses evaluating their vendors and for consumers deciding where to spend their hard-earned dollars.
Leading Indicators: Spotting Inflation Before It Arrives
Professional investors don’t wait for the CPI report to find inflation; they look for leading indicators that suggest prices are about to rise. By monitoring these areas, you can position your portfolio or business ahead of the curve.
The Producer Price Index (PPI)
The Producer Price Index measures the change in prices received by domestic producers for their output. In simpler terms, it tracks the cost of doing business. If the costs of raw materials, energy, and labor rise for manufacturers, those costs are eventually passed down to the consumer. Finding a spike in the PPI is often a 3-to-6-month warning that a spike in the CPI is imminent.
Commodity Markets and Supply Chains
Inflation often begins at the source. Monitoring the prices of “Doctor Copper” (so named because copper prices are seen as having a Ph.D. in economics due to its widespread industrial use), crude oil, and agricultural commodities like wheat and corn can provide early signals. When the cost of moving goods (freight rates) and the cost of raw materials rise, inflation is usually not far behind.
The Yield Curve and Breakeven Inflation Rates
In the world of finance, the bond market is often considered the smartest “person” in the room. By looking at the “Breakeven Inflation Rate”—the difference between the yield on a nominal Treasury bond and an Inflation-Protected Security (TIPS) of the same maturity—investors can see exactly what the market expects inflation to be over the next 5 or 10 years. If the breakeven rate is rising, it means professional traders are “finding” inflation risks that haven’t hit the headlines yet.

Conclusion: Protecting Wealth in an Inflationary Era
Finding inflation is only the first half of the battle; the second half is responding to it. Once you have identified where and how prices are rising, the focus must shift to preserving purchasing power. This involves moving away from “cash-heavy” positions, which lose value as inflation rises, and toward assets that historically outpace or track with inflation.
From investing in Treasury Inflation-Protected Securities (TIPS) and I-Bonds to maintaining a diversified portfolio of equities and real estate, the goal is to ensure that your rate of return exceeds the rate of inflation. By using the tools of the BLS, tracking your personal spending, and remaining vigilant against subtle market shifts like shrinkflation, you can transform inflation from a hidden threat into a manageable financial variable. Knowledge is the best hedge against a rising cost of living; by knowing where to find inflation, you gain the power to stay ahead of it.
aViewFromTheCave is a participant in the Amazon Services LLC Associates Program, an affiliate advertising program designed to provide a means for sites to earn advertising fees by advertising and linking to Amazon.com. Amazon, the Amazon logo, AmazonSupply, and the AmazonSupply logo are trademarks of Amazon.com, Inc. or its affiliates. As an Amazon Associate we earn affiliate commissions from qualifying purchases.