Understanding how to figure out percentage change is more than just a mathematical exercise; it is a fundamental skill for anyone looking to master their personal or business finances. In the world of money, numbers rarely tell the full story in isolation. A $1,000 profit might seem significant, but its true value depends entirely on whether it represents a 1% gain on a million-dollar investment or a 100% gain on a thousand-dollar venture.
Percentage change is the universal language of growth, decline, and volatility. It allows investors to compare apples to oranges, enabling a side-by-side analysis of a high-growth tech stock, a steady dividend-paying utility, and a high-yield savings account. This guide explores the mechanics of percentage change through the lens of finance, providing you with the tools to evaluate investment performance, track business growth, and navigate the complexities of inflation.
The Mathematical Foundation: Mastering the Core Formula
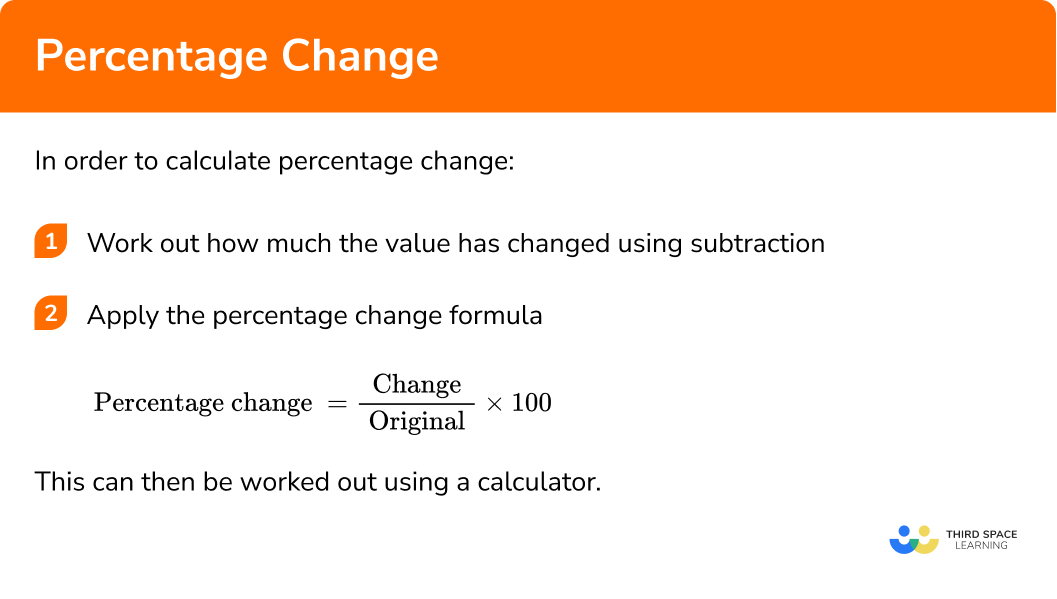
At its heart, calculating percentage change is a straightforward process, but its implications in financial planning are profound. To find the percentage change, you must determine the difference between the “new” value and the “old” (original) value, then divide that difference by the original value.
The Basic Equation
The standard formula is:
[(New Value – Old Value) / |Old Value|] × 100
In a financial context, the “Old Value” is your initial investment or starting capital, and the “New Value” is the current market value or the value at the end of a specific period. For example, if you purchased a share of a company for $150 and it is now worth $180, the calculation would be:
($180 – $150) / $150 = 0.20.
Multiplying by 100 gives you a 20% increase.
Distinguishing Between Gains and Losses
One of the most critical aspects of percentage change in finance is understanding directionality. A positive result indicates a gain or growth, while a negative result indicates a loss or contraction. However, the math of recovery is not symmetrical.
If an investment of $1,000 drops by 50%, it is worth $500. To return to your original $1,000, that $500 must grow by $500—which is a 100% increase. This phenomenon, often called “volatility drag,” is why seasoned investors focus so heavily on downside protection. Understanding the percentage change required to recover from a loss is vital for risk management and long-term wealth preservation.
Common Pitfalls in Calculation
A frequent error in financial reporting involves confusing “percentage points” with “percentage change.” If a central bank raises interest rates from 3% to 4%, that is a 1 percentage point increase, but it is a 33.3% change in the interest rate itself. In business finance, misidentifying the “base” (the Old Value) can lead to skewed data that misrepresents the health of a company. Always ensure your denominator represents the true starting point of the period being analyzed.
Analyzing Investment Performance: ROI and CAGR
For the individual investor, percentage change is the primary metric for gauging the success of an asset allocation strategy. Whether you are trading cryptocurrencies, stocks, or real estate, you need a standardized way to measure how hard your money is working for you.
Return on Investment (ROI)
ROI is the most common application of percentage change in the financial world. It measures the efficiency of an investment. However, simple ROI can be misleading because it does not account for the element of time. A 50% return is incredible if achieved in one year, but less impressive if it took twenty years to realize. To gain a deeper insight, investors often look at “annualized” percentage changes to compare assets held over different durations.
The Power of Compound Annual Growth Rate (CAGR)
While simple percentage change tells you the total growth from point A to point B, CAGR provides the mean annual growth rate of an investment over a specified period longer than one year. It “smoothes” out the volatility, representing the rate at which the investment would have grown if it had grown at a steady rate each year with profits reinvested.
The formula for CAGR is:
[(Ending Value / Beginning Value)^(1 / Number of Years)] – 1
Using CAGR allows you to compare the performance of a volatile asset, like a growth stock, against a stable asset, like a bond. It highlights the reality of compounding, which is often called the “eighth wonder of the world” in finance. By figuring out the percentage change through the lens of CAGR, you can more accurately project your retirement savings and future wealth.

Dividend Adjustments and Total Return
When calculating the percentage change of a stock, many beginners only look at the “price action.” However, a professional financial analysis focuses on “Total Return.” This includes the percentage change in the stock price plus the impact of dividends or interest earned during the holding period. For many blue-chip stocks, the dividends contribute significantly to the total percentage gain over time, often outperforming the raw price appreciation of “flashier” non-dividend-paying stocks.
Business Finance: Tracking Growth and Margins
In the corporate world, percentage change is the pulse of the company. It is used by CFOs and analysts to determine if a business is scaling efficiently or if it is at risk of insolvency.
Year-over-Year (YoY) and Month-over-Month (MoM) Analysis
Businesses use percentage change to compare current performance against previous periods. YoY growth is particularly vital because it accounts for seasonality. For instance, a retail business might see a 50% MoM increase in revenue in December due to holiday shopping. While that looks great on paper, a YoY comparison might reveal that revenue is actually down 5% compared to last December, indicating a decline in market share or consumer demand.
Profit Margin Fluctuations
Percentage change is also applied to internal efficiencies. If a company’s revenue grows by 10% but its operating expenses grow by 15%, the “percentage change” in profit margins will be negative. This tells management that while the company is “bigger,” it is becoming less “profitable.” Figuring out these percentages allows business owners to pinpoint where costs are spiraling out of control and where they need to trim the fat to maintain a healthy bottom line.
Market Share and Competitive Benchmarking
In a competitive landscape, your absolute revenue numbers matter less than your percentage change relative to the industry average. If the total market for a product grows by 20% but your company’s sales only grow by 10%, your “relative” percentage change is negative—you are losing market share despite having “positive” growth. Financial literacy involves looking at these percentages in context to understand the true trajectory of a business.
The Impact of Inflation and Purchasing Power
Perhaps the most overlooked application of percentage change is its role in maintaining purchasing power. In finance, we distinguish between “Nominal” and “Real” returns.
Real vs. Nominal Percentage Change
Nominal percentage change is the raw number you see on your bank statement. If your savings account offers a 4% annual interest rate, your nominal gain is 4%. However, the “Real” percentage change must account for inflation. If the Consumer Price Index (CPI)—the standard measure for the percentage change in the cost of goods—rises by 5% in that same year, your “Real” return is actually -1%. You have more dollars, but those dollars can buy fewer goods than they could a year ago.
The Consumer Price Index (CPI) and Personal Budgeting
For individuals, tracking the percentage change in personal expenses is essential for maintaining a lifestyle. If your salary increases by 3% (a positive percentage change) but your rent, groceries, and utilities increase by 7%, you are experiencing a “net negative” change in your financial health. By calculating these percentages, you can make informed decisions about when to ask for a raise, when to cut back on discretionary spending, or when to move your capital into assets that historically hedge against inflation, such as real estate or certain commodities.
Leveraging Digital Financial Tools for Accuracy
While the manual formula is vital for understanding the “why,” modern financial management relies on digital tools to track percentage changes across complex portfolios and multi-year business cycles.
Using Spreadsheets for Financial Analysis
Programs like Microsoft Excel and Google Sheets are the industry standard for financial modeling. To figure out percentage change in a spreadsheet, you would use a simple formula: =(B2-A2)/A2, where A2 is the starting value and B2 is the ending value. By dragging this formula across hundreds of rows, an investor can instantly see the performance of every asset in their portfolio, allowing for quick rebalancing and data-driven decision-making.
Financial Calculators and Portfolio Trackers
For those who prefer a more automated approach, various financial tools and apps provide real-time percentage change tracking. Most brokerage platforms provide “Time-Weighted Return” and “Money-Weighted Return” calculations automatically. These tools are essential for identifying underperforming sectors of a portfolio.
However, relying solely on automated tools without understanding the underlying math can be dangerous. A professional understands that a “10% gain” on a dashboard might be gross of taxes and fees. By knowing how to manually figure out the percentage change, you can audit your tools to ensure that your “net” gains—the money that actually ends up in your pocket—are being calculated accurately.
Conclusion
Mastering the calculation of percentage change is a transformative step in financial literacy. It moves you away from looking at static numbers and toward understanding the dynamic flow of wealth. Whether you are calculating the ROI of a new investment, the YoY growth of a startup, or the real-world impact of inflation on your savings, the ability to figure out percentage change provides the clarity needed to navigate the complex world of money with confidence and precision.
aViewFromTheCave is a participant in the Amazon Services LLC Associates Program, an affiliate advertising program designed to provide a means for sites to earn advertising fees by advertising and linking to Amazon.com. Amazon, the Amazon logo, AmazonSupply, and the AmazonSupply logo are trademarks of Amazon.com, Inc. or its affiliates. As an Amazon Associate we earn affiliate commissions from qualifying purchases.