Understanding how to calculate a decrease percentage is a foundational skill that transcends simple arithmetic; it is an indispensable tool for informed decision-making across all facets of finance. From meticulously managing personal budgets to strategically navigating complex investment landscapes and robustly analyzing business performance, the ability to quantify reductions provides clarity, highlights trends, and empowers individuals and organizations to take proactive steps. Whether you’re tracking a drop in monthly expenses, assessing a decline in investment value, or analyzing a dip in quarterly sales, mastering this calculation is critical for identifying areas of concern, celebrating efficiencies, and making sound financial judgments.

This comprehensive guide will break down the decrease percentage calculation, illustrating its profound relevance in personal finance, investment strategies, and business operations. By grasping this concept, you unlock a deeper understanding of financial dynamics and gain a powerful analytical capability that can significantly impact your financial well-being and strategic planning.
The Fundamental Formula: Understanding the Decrease Percentage
At its core, calculating the decrease percentage is about quantifying the relative change between an initial value and a subsequent, smaller value. It expresses this reduction as a proportion of the original amount, typically represented as a percentage. This provides a standardized way to compare decreases, regardless of the absolute numbers involved.
Deconstructing the Formula
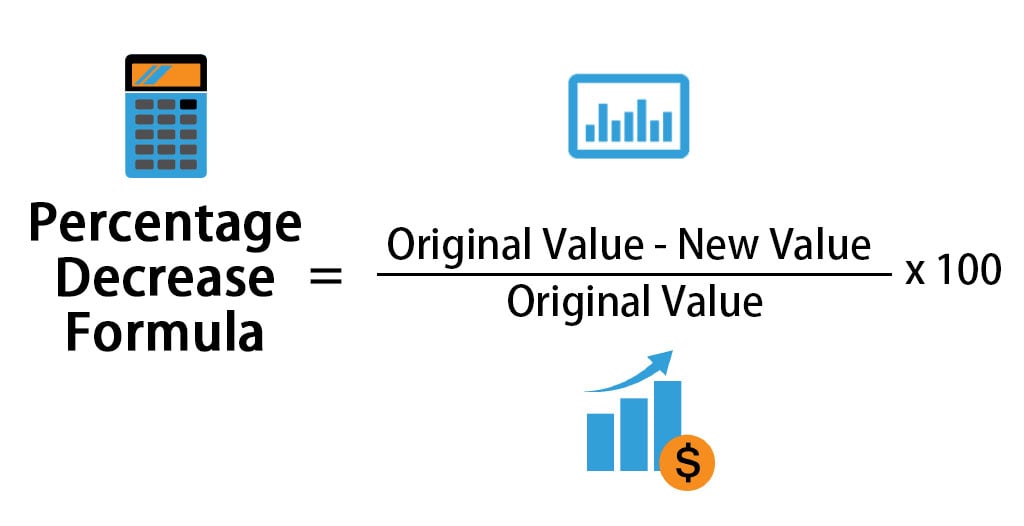
The formula for calculating the decrease percentage is straightforward:
Decrease Percentage = ((Original Value – New Value) / Original Value) × 100
Let’s break down each component:
- Original Value: This is the starting point, the initial amount before any reduction occurred. It serves as the baseline against which the decrease is measured.
- New Value: This is the final amount after the decrease has taken place. It must be less than the Original Value for a decrease percentage to be calculated.
- (Original Value – New Value): This part of the formula calculates the absolute amount of the decrease. It tells you exactly how much the value has gone down.
- ((Original Value – New Value) / Original Value): This ratio expresses the absolute decrease as a fraction of the original value. This is the decimal form of the decrease.
- × 100: Multiplying by 100 converts the decimal fraction into a percentage, making it easier to read and understand in a financial context.
Simple Example:
Suppose your monthly electricity bill decreased from $150 (Original Value) to $120 (New Value).
- Absolute Decrease: $150 – $120 = $30
- Fractional Decrease: $30 / $150 = 0.20
- Decrease Percentage: 0.20 × 100 = 20%
This means your electricity bill decreased by 20%.
Key Considerations Before Calculation
Before plugging numbers into the formula, a few critical considerations ensure accuracy and meaningful insights:
- Ensuring Consistent Units: Always ensure that both the original and new values are expressed in the same units (e.g., dollars, units, kilograms). Mixing units will lead to incorrect results.
- Identifying the True ‘Original’ Value: This might seem obvious, but it’s crucial to correctly identify the starting point. For instance, if you’re tracking month-over-month sales, the original value for July would be June’s sales figures. If you’re looking at year-over-year, it would be the previous year’s figure.
- Understanding the ‘New’ Value: The ‘New Value’ must logically be the amount after the decrease. Double-checking that the New Value is indeed less than the Original Value confirms you are calculating a decrease, not an increase. If the New Value is greater, you would be calculating an increase percentage.
Personal Finance Applications: Managing Your Money Wisely
In personal finance, calculating the decrease percentage is a powerful tool for self-assessment and strategic adjustment. It allows individuals to quantify their progress towards financial goals and identify areas for improvement.
Tracking Expenses and Budgeting
One of the most practical applications is in monitoring spending habits. By calculating the percentage decrease in various expense categories, you can gauge the effectiveness of your budgeting efforts.
- Assessing Cost-Cutting Measures: Did you try to reduce your dining-out expenses? Comparing last month’s $400 bill to this month’s $300 bill reveals a (($400 – $300) / $400) * 100 = 25% decrease. This quantifiable success can motivate further savings.
- Identifying Trends: A consistent percentage decrease in a particular expense category over several months might indicate a successful lifestyle change or a new, more economical habit. Conversely, a lack of decrease could signal areas needing more attention.
Debt Reduction Strategies
For anyone aiming to pay down debt, tracking the percentage decrease in principal balance is incredibly motivating and provides a clear picture of progress.
- Measuring Progress on Loans: If your initial mortgage principal was $300,000 and it’s now $270,000, you’ve reduced your principal by (($300,000 – $270,000) / $300,000) * 100 = 10%. This percentage offers a more intuitive understanding of your achievement than just the raw dollar amount.
- Credit Card Debt: Seeing a 50% reduction in your credit card balance from $10,000 to $5,000 provides a significant psychological boost and reinforces disciplined spending.
Income Fluctuations and Savings Goals
While ideally, income increases, sometimes a decrease can occur due to job changes, reduced hours, or market shifts. Calculating the percentage decrease helps in adjusting budgets and savings goals realistically.
- Adjusting to Income Loss: If your monthly income drops from $5,000 to $4,500, that’s a (($5,000 – $4,500) / $5,000) * 100 = 10% decrease. This quantifiable drop helps you understand the magnitude of the impact and revise your spending and saving plans accordingly.
- Revisiting Savings Goals: A significant income decrease might necessitate a temporary percentage reduction in your monthly savings contributions to maintain financial stability.
Investing Insights: Navigating Market Volatility and Portfolio Performance
In the world of investing, understanding decrease percentages is paramount. It allows investors to realistically assess risks, quantify losses, and make informed decisions during market fluctuations.
Assessing Investment Losses
When asset values decline, calculating the percentage decrease helps investors understand the severity of the loss in relation to the initial investment.
- Stock Price Drops: If a stock you own drops from $100 per share to $80, it’s a (($100 – $80) / $100) * 100 = 20% decrease. This percentage is crucial for comparing the performance of different stocks or for understanding how much ground needs to be recovered.
- Portfolio Drawdowns: Calculating the percentage decrease from your portfolio’s peak value to its current value (known as a drawdown) gives you a clear picture of its overall resilience during downturns. A 10% portfolio decrease is typically less concerning than a 40% decrease, which would require a significantly larger percentage gain to recover.
Evaluating Portfolio Rebalancing Needs
Market downturns often lead to certain asset classes decreasing more than others. Calculating these percentage decreases can inform rebalancing strategies.
- Identifying Underperformers: If your bond allocation decreased by 5% but your equity allocation decreased by 20%, the significant percentage drop in equities might indicate an opportunity to buy more at a lower price, bringing your portfolio back to its target asset allocation.
- Informing “Buy the Dip” Strategies: A significant percentage decrease in a fundamentally sound investment might signal a “buy the dip” opportunity for long-term investors.
Understanding Market Corrections and Crashes
Decrease percentages are used to define various market events, providing a common language for investors and analysts.
- Market Correction: Generally defined as a decline of 10-20% from a market peak.
- Bear Market: Typically characterized by a decline of 20% or more from recent highs.
Understanding these percentage thresholds helps investors contextualize current market events against historical data and manage their expectations and emotional responses during volatile periods.
Business Finance and Operations: Driving Strategic Decisions
For businesses, calculating decrease percentages is essential for performance analysis, operational efficiency, and strategic planning. It helps identify challenges, measure the success of initiatives, and allocate resources effectively.
Sales and Revenue Performance Analysis
Monitoring sales and revenue decreases is critical for understanding market dynamics and business health.
- Quarterly/Annual Revenue Drops: If a company’s Q3 revenue was $5 million, down from $6 million in Q2, that’s a (($6M – $5M) / $6M) * 100 = 16.67% decrease. This significant drop would trigger an investigation into the causes – market competition, product issues, economic downturn, etc.
- Product Line Performance: Analyzing percentage decreases in sales for specific products or services helps identify those that are losing market appeal or facing stiff competition, allowing for timely adjustments or discontinuation.
Cost Reduction and Efficiency Measures
Businesses constantly seek ways to reduce costs and improve efficiency. Decrease percentages provide a clear metric for evaluating these efforts.
- Operating Expense Reduction: If manufacturing costs decreased from $100,000 to $90,000 after implementing new processes, that’s a (($100,000 – $90,000) / $100,000) * 100 = 10% reduction. This quantifies the success of the efficiency initiative.
- Inventory Shrinkage: A decrease in the percentage of lost or damaged inventory from 5% to 3% reflects improved inventory management.
Profitability and Margins
Profit margins are vital indicators of a company’s financial health. Tracking their percentage decrease reveals pressures on the bottom line.
- Gross Profit Margin Decline: If your gross profit margin drops from 40% to 35%, it’s a relative decrease of ((40-35)/40)*100 = 12.5%. This indicates that either revenues are decreasing or the cost of goods sold is increasing faster than sales.
- Net Profit Margin: A sustained decrease in net profit margin signals broader issues with revenue generation, cost control, or operational efficiency.
Market Share and Customer Churn
Understanding a decrease in market share or an increase in customer churn (which implies a decrease in customer base) is crucial for competitive analysis and customer retention strategies.
- Market Share Loss: If a company’s market share drops from 20% to 18%, that’s a relative decrease of ((20-18)/20)*100 = 10%. This signals competitive pressure or a failure to meet customer needs.
- Customer Churn Rate: While churn is often expressed as an increase, it inherently represents a decrease in your customer base. A 10% monthly churn rate means you are losing 10% of your customers each month, highlighting a critical business challenge.
Tools and Best Practices for Accurate Calculation
While the formula is simple, employing the right tools and adhering to best practices ensures accuracy and efficient analysis.
Leveraging Spreadsheets and Financial Calculators
- Spreadsheet Software (Excel/Google Sheets): These are invaluable for financial analysis. You can easily set up columns for Original Value, New Value, and use a formula like
=(B2-C2)/B2*100(assuming Original Value in B2, New Value in C2) to automate calculations across large datasets. This is particularly useful for tracking trends over time. - Online Financial Calculators: For quick, one-off calculations, numerous free online percentage calculators can provide instant results, reducing the chance of manual errors.
Avoiding Common Pitfalls
- Mistaking Increase for Decrease: Always verify that the New Value is indeed smaller than the Original Value. If it’s larger, you’re looking for an increase percentage.
- Using the Wrong Base Value: The Original Value must always be the denominator. Using the New Value as the base will lead to an incorrect and often misleading percentage.
- Rounding Errors: While tempting to round numbers prematurely, try to carry calculations to several decimal places before rounding the final percentage for precision, especially in complex financial models.
The Importance of Context and Interpretation
A percentage decrease, by itself, is only a number. Its true value lies in its interpretation within context.
- Not Always Negative: A decrease percentage in costs (e.g., manufacturing costs, operating expenses) is generally a positive outcome, reflecting efficiency gains. Conversely, a decrease in revenue or investment value is typically a negative indicator.
- Benchmarking: Compare your calculated decrease percentage against industry averages, competitor performance, or historical data. A 5% sales decrease might be alarming for a fast-growing industry but acceptable in a declining market.
- Long-term vs. Short-term: A short-term decrease might be a temporary blip, while a sustained pattern of decrease over several periods signals a more significant underlying issue.
Conclusion
The ability to accurately calculate the decrease percentage is a vital component of financial literacy and strategic decision-making. As we’ve explored, its applications span personal budgeting, investment analysis, and critical business operations, offering a clear, quantifiable metric for evaluating change. From identifying spending reductions and assessing investment drawdowns to diagnosing declining revenues and measuring cost efficiencies, this fundamental calculation empowers you to interpret financial data with greater precision.
Mastering this concept moves beyond mere number crunching; it fosters a deeper understanding of financial dynamics, enabling you to identify trends, evaluate performance, and make proactive, informed choices that safeguard and enhance your financial position. Embrace this essential tool, and leverage its power to navigate the complexities of your financial world with greater confidence and insight.
aViewFromTheCave is a participant in the Amazon Services LLC Associates Program, an affiliate advertising program designed to provide a means for sites to earn advertising fees by advertising and linking to Amazon.com. Amazon, the Amazon logo, AmazonSupply, and the AmazonSupply logo are trademarks of Amazon.com, Inc. or its affiliates. As an Amazon Associate we earn affiliate commissions from qualifying purchases.