In the world of finance, numbers are the primary language of progress. Whether you are tracking the growth of a retirement portfolio, evaluating the performance of a small business, or simply trying to understand how inflation is impacting your monthly grocery bill, the ability to calculate and interpret percentage change is an indispensable skill. Percentage change provides a standardized way to measure the relative difference between two values over time, stripping away the noise of raw numbers to reveal the underlying trend.
To master your money, you must move beyond looking at absolute dollars and start looking at relative growth. A $100 gain is impressive on a $1,000 investment (10%), but it is negligible on a $1,000,000 portfolio (0.01%). This guide will walk you through the mechanics of calculating percentage change and, more importantly, how to apply this metric across various financial contexts to make more informed, data-driven decisions.

The Fundamentals of Financial Mathematics: Understanding the Formula
Before diving into complex investment strategies, one must have a rock-solid grasp of the basic arithmetic that governs financial growth. Percentage change is the tool used to quantify the “velocity” of your money—how fast it is growing or shrinking.
Understanding the Core Formula
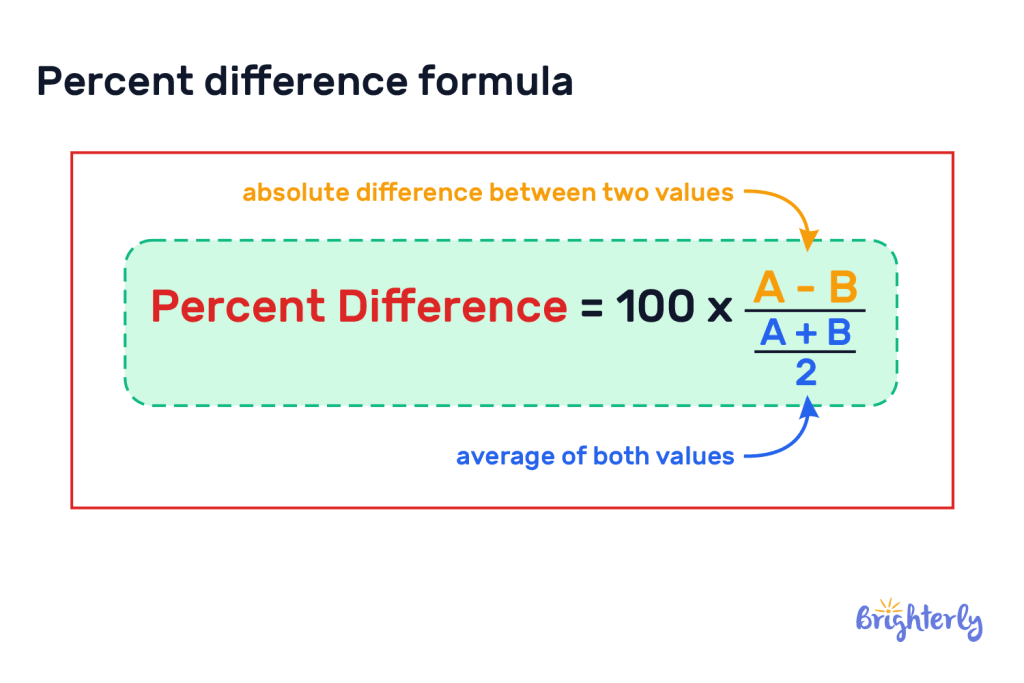
The formula for percentage change is one of the most vital equations in personal and business finance. It is expressed as:
Percentage Change = [(New Value – Old Value) / |Old Value|] × 100
To find the percentage change, you first subtract the original value (the “Old Value”) from the current value (the “New Value”). This gives you the “absolute change.” You then divide that absolute change by the original value to determine the “relative change.” Finally, you multiply by 100 to convert that decimal into a percentage.
For example, if you purchased a share of a tech company for $150 and it is now worth $180, your calculation would be:
- $180 – $150 = $30 (Absolute Change)
- $30 / $150 = 0.2 (Relative Change)
- 0.2 × 100 = 20%
This 20% represents the growth of your capital, a figure far more descriptive than simply saying you made thirty dollars.
The Difference Between Increase and Decrease
It is crucial to note that the formula naturally accounts for both gains and losses. If the resulting number is positive, you have experienced a percentage increase (growth). If the number is negative, you have experienced a percentage decrease (a loss).
In financial planning, understanding the asymmetry between increases and decreases is vital. For instance, if your investment portfolio drops by 50%, you do not need a 50% gain to get back to where you started; you need a 100% gain. Calculating percentage change helps investors visualize the “recovery hurdle” required after a market downturn, allowing for better risk management and more realistic expectations.
Applying Percentage Change to Investment Performance
In the realm of investing, percentage change is the universal yardstick. It allows investors to compare apples to oranges—comparing the performance of a high-priced stock to a low-priced crypto asset, or a real estate holding to a mutual fund.
Tracking Portfolio Growth
Active investors use percentage change to monitor their total portfolio health over specific intervals—monthly, quarterly, or annually. By calculating the percentage change of your total net worth or specific brokerage accounts, you can determine if your current asset allocation is meeting your long-term financial goals.
Professional wealth managers often use “Time-Weighted Rate of Return,” which is essentially a series of percentage change calculations that eliminate the distorting effects of new deposits or withdrawals. By focusing purely on the percentage change of the underlying assets, you can objectively judge whether your investment strategy is outperforming a benchmark like the S&P 500.
Evaluating Stock Market Volatility
Volatility is often measured by how much a stock’s price fluctuates in terms of percentage change over a short period. For day traders and swing traders, calculating the “daily range” as a percentage of the opening price is essential for setting “stop-loss” orders.
If a stock typically moves 2% per day, setting a stop-loss at 1% might result in being forced out of a position prematurely due to standard “market noise.” By understanding the historical percentage changes of an asset, an investor can better calibrate their risk tolerance and avoid emotional decision-making during periods of market turbulence.
Real Estate Appreciation and Return on Investment (ROI)
Real estate is another sector where percentage change is a primary indicator of success. Property owners calculate the percentage change in home values to determine equity growth. However, in real estate, the “Cash-on-Cash Return” is often more important. This is a specific type of percentage change calculation where the “Old Value” is the actual cash invested (down payment) and the “New Value” is the annual pre-tax cash flow. Because of leverage (mortgages), a 5% increase in the total property value can result in a much higher percentage change in the investor’s actual equity.
Business Finance and Profitability Analysis
For entrepreneurs and corporate executives, percentage change is the heartbeat of the company’s financial statements. It provides context to the raw data found in balance sheets and income statements.
Year-over-Year (YoY) Revenue Growth
Raw revenue figures can be misleading due to seasonality. A retail business might make $500,000 in December and only $200,000 in January. Looking at the month-over-month percentage change would suggest a disaster. Instead, businesses use Year-over-Year (YoY) percentage change, comparing January of the current year to January of the previous year.
YoY growth is a key metric for investors and lenders. A company that consistently shows a 15% YoY revenue increase is often viewed as a healthy, “growth-stage” company, regardless of the specific dollar amounts involved.
Monitoring Margin Fluctuations
Profitability isn’t just about how much you sell; it’s about how much you keep. Calculating the percentage change in “Gross Margin” and “Operating Margin” is essential for identifying inefficiencies. If a company’s revenue increases by 20% but its net profit only increases by 5%, the percentage change analysis reveals that expenses are growing faster than sales. This “margin compression” is a red flag that requires immediate operational adjustment, such as renegotiating supplier contracts or reducing overhead.
Analyzing Expense Reduction
On the flip side of the ledger, percentage change is used to track the success of “lean” initiatives. If a business sets a goal to reduce utility costs, they will track the percentage change in those specific line items month-over-month. Seeing a 12% reduction in operational waste is a clear, quantifiable victory for a management team, providing a tangible metric for performance reviews and bonus structures.
Personal Finance and Budgeting Applications
You don’t need to be a Wall Street analyst to benefit from these calculations. In fact, percentage change is perhaps most powerful when applied to the “micro-economy” of your household budget.
Measuring Inflationary Impact on Purchasing Power
Inflation is essentially the percentage change in the Consumer Price Index (CPI). For the individual, it is helpful to calculate the percentage change in your own “personal inflation rate.” If your rent increases by 10% and your grocery costs increase by 15%, but your salary only increases by 3%, calculating these percentage changes reveals a “real income” deficit. This data provides the leverage needed to negotiate a raise or the clarity required to cut back on discretionary spending.
Tracking Debt Reduction Progress
For those working toward financial freedom, calculating the percentage change in total debt is a major psychological motivator. Using the “Debt Snowball” or “Debt Avalanche” method is effective, but seeing the percentage of your total debt decrease by 5% every month provides a sense of momentum. It shifts the focus from the daunting total balance to the steady, incremental progress being made.
Optimizing Savings Rate Growth
One of the most important numbers in personal finance is your “Savings Rate”—the percentage of your income that you keep. By calculating the percentage change in your savings rate over time, you can gamify your financial life. If you saved 10% of your income last year and 12% this year, you haven’t just saved 2% more; you have increased your savings efficiency by 20%. This type of analysis encourages a “growth mindset” regarding wealth accumulation.
Common Pitfalls and Advanced Financial Context
While the formula for percentage change is simple, the interpretation of the results requires nuance. Misunderstanding the context of a percentage can lead to poor financial choices.
The Dangers of the “Zero-Base” Problem
One mathematical quirk to be aware of is the “zero-base” or “low-base” effect. If a startup company makes $1 in its first year and $1,000 in its second year, the percentage change is a staggering 99,900%. While mathematically accurate, it is practically meaningless for predicting future growth. Investors must always look at the absolute numbers alongside the percentage change to ensure the “Old Value” was significant enough to make the percentage meaningful.
Percentage Change vs. Percentage Points
A common error in financial reporting is confusing “percentage change” with “percentage points.” If a central bank raises interest rates from 3% to 4%, that is a 1 percentage point increase. However, the percentage change in the interest rate is actually 33.3% ( (4-3)/3 ). In the world of lending and bonds, this distinction is massive. A 1-point increase in an interest rate can lead to a 33% increase in the interest expense for a borrower, illustrating why small fluctuations in rates have such a dramatic impact on the global economy.
Conclusion: The Power of Relative Thinking
Mastering the calculation of percentage change is more than just a math exercise; it is a shift in perspective. It allows you to see past the surface level of your finances and understand the underlying trends that dictate your long-term wealth. By consistently applying this formula to your investments, your business operations, and your personal spending, you move from being a passive observer of your money to an active, informed manager of your financial future. Whether the market is up or down, the percentage change is the compass that keeps your financial strategy on course.
aViewFromTheCave is a participant in the Amazon Services LLC Associates Program, an affiliate advertising program designed to provide a means for sites to earn advertising fees by advertising and linking to Amazon.com. Amazon, the Amazon logo, AmazonSupply, and the AmazonSupply logo are trademarks of Amazon.com, Inc. or its affiliates. As an Amazon Associate we earn affiliate commissions from qualifying purchases.