In the world of finance, numbers are the language of progress. Whether you are tracking the growth of a retirement account, evaluating the success of a side hustle, or analyzing the quarterly performance of a Fortune 500 company, the ability to calculate the percentage difference between two numbers is perhaps the most fundamental skill in a wealth-builder’s toolkit.
Understanding percentages allows investors and savers to move beyond raw data and into the realm of relative value. A $100 gain is impressive on a $500 investment, but negligible on a $1,000,000 portfolio. By mastering the “how” and “why” of percentage calculations, you gain the clarity needed to make informed decisions about where to allocate your capital for maximum impact.

The Fundamentals of Percentage Change in Personal Finance
At its core, calculating the percentage difference between two numbers is the process of identifying the “rate of change.” In money management, we use this to determine how much an asset has appreciated or depreciated over a specific period.
The Standard Formula for Percentage Increase and Decrease
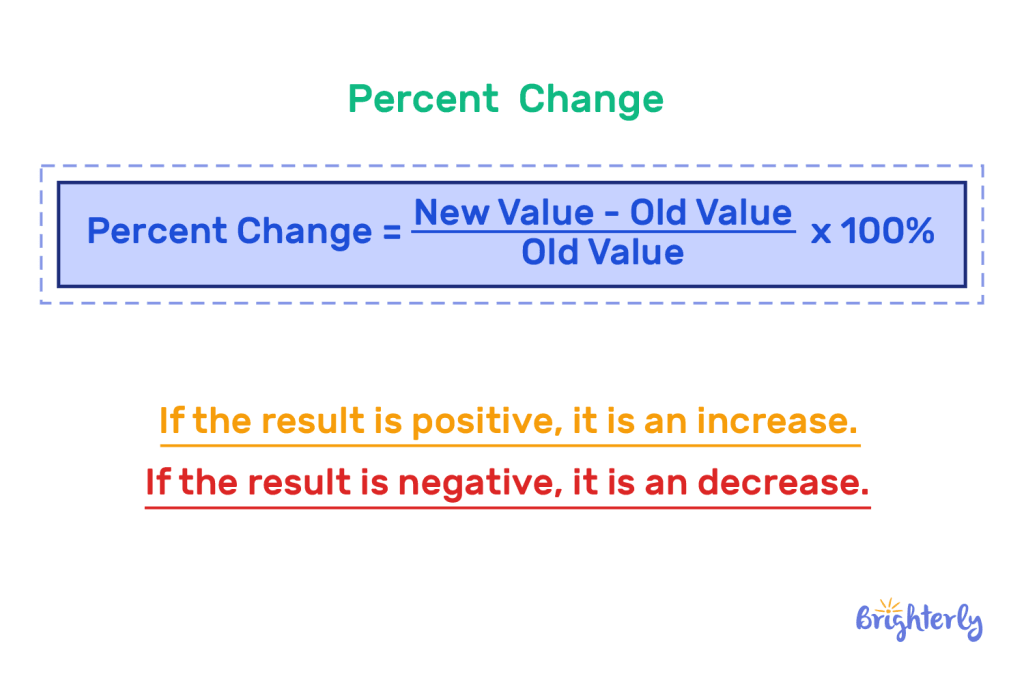
To find the percentage change between an original value (Value A) and a new value (Value B), the mathematical formula is consistent regardless of the asset class:
Percentage Change = [(New Value – Old Value) / |Old Value|] × 100
For example, if you purchased a share of a tech company for $150 (Old Value) and its current market price is $180 (New Value), the calculation would look like this:
- $180 – $150 = $30 (The absolute change)
- $30 / $150 = 0.2
- 0.2 × 100 = 20%
This 20% represents your capital appreciation. Understanding this basic formula is the first step toward sophisticated financial literacy.
Why Direction Matters: Gains vs. Losses
In the context of money, the direction of the percentage change is vital. A positive result indicates growth, while a negative result indicates a loss. However, there is a mathematical quirk in finance known as “asymmetric volatility” that every investor must understand.
If your portfolio drops by 50%, you do not need a 50% gain to get back to even; you need a 100% gain. For instance, if $100 drops to $50, that is a 50% loss. To get from $50 back to $100, you must double your money—a 100% increase. This is why calculating percentages is not just a mathematical exercise; it is a risk management strategy. By monitoring percentage drawdowns, you can better protect your principal investment.
Measuring Investment Performance and Portfolio Growth
Investors use percentages to compare “apples to oranges.” Without percentages, it would be impossible to compare the performance of a high-yield savings account to a volatile cryptocurrency or a steady dividend-paying stock.
Calculating Return on Investment (ROI)
Return on Investment (ROI) is the most common application of percentage calculation in the business and investing world. It measures the efficiency of an investment. The formula is essentially the percentage change formula applied to your total cost basis.
When calculating ROI, it is important to include all costs (commissions, fees, taxes) and all inflows (dividends, interest). If you invested $10,000 in a rental property and, after all expenses, your net profit at the end of the year was $1,200, your ROI is ($1,200 / $10,000) × 100 = 12%. This allows you to compare that property’s performance against the S&P 500’s historical average of roughly 10%, giving you a clear indicator of whether your capital is working hard enough.
Understanding Compound Annual Growth Rate (CAGR)
While simple percentage change tells you how much you made over a total period, the Compound Annual Growth Rate (CAGR) provides the “smoothed” annual return. This is crucial for long-term financial planning, such as calculating how much you need to save for retirement.
CAGR accounts for the fact that money compounds over time. If your portfolio grew from $50,000 to $80,000 over five years, the total percentage increase is 60%. However, you didn’t grow by 12% each year (60 divided by 5). Because of compounding, your CAGR is actually lower (approximately 9.8%). Knowing how to calculate these nuanced percentages helps you set realistic expectations for your wealth-building journey.
Budgeting and Debt Management Metrics
Percentage calculations are equally important on the “outflow” side of your balance sheet. Tracking expenses as percentages of your total income provides a much clearer picture of financial health than looking at dollar amounts alone.

The Debt-to-Income Ratio
Financial institutions and savvy individuals use the Debt-to-Income (DTI) ratio to measure fiscal stability. This is calculated by taking your total monthly debt payments and dividing them by your gross monthly income.
If your monthly debt (mortgage, car loan, student loans) totals $2,000 and your gross income is $6,000, your DTI is 33.3%. In the world of personal finance, keeping this percentage below 36% is generally considered healthy. By calculating this percentage regularly, you can see if a raise at work is actually improving your financial freedom or if “lifestyle creep” is causing your debt percentages to climb alongside your income.
Tracking Expense Variations over Time
Percentages allow you to perform a “Vertical Analysis” of your budget. If you spent $400 on groceries last month and $500 this month, the $100 increase might seem manageable. However, calculating the percentage change reveals a 25% increase in food costs.
When you see a 25% spike in a single category, it serves as a red flag to investigate further. Is it a result of inflation, or have your spending habits shifted? By applying percentage calculations to your monthly budget, you can identify trends before they become financial crises.
Business Finance: Margin and Markup Analysis
For entrepreneurs and side-hustlers, understanding the percentage difference between cost and price is the difference between a thriving business and bankruptcy. Two terms often confused are “margin” and “markup,” both of which rely on percentage calculations between two numbers.
Calculating Gross Profit Margins
Profit margin is the percentage of the selling price that is profit. If you sell a product for $100 (Value B) and it costs you $70 to make (Value A), your profit is $30.
The margin calculation is: (Profit / Revenue) × 100.
In this case: ($30 / $100) × 100 = 30%.
This percentage tells you how much of every dollar earned stays in the business to cover operating expenses and net profit. High-margin businesses are generally more resilient to economic downturns because they have a larger “buffer” to absorb rising costs.
The Difference Between Margin and Markup
Markup, while using the same two numbers ($70 cost and $100 price), is calculated differently. Markup is the percentage added to the cost to reach the selling price.
The markup calculation is: (Profit / Cost) × 100.
In this case: ($30 / $70) × 100 = 42.8%.
Understanding the percentage difference between these two metrics is vital. If a business owner mistakenly uses a 30% markup when they intended to have a 30% margin, they will consistently underprice their products, leading to lower-than-expected profits.
Tools and Strategies for Automating Financial Calculations
In the modern era, you don’t need to do these calculations by hand, but you do need to know how to set up the logic in your digital tools. Accuracy in these calculations is the bedrock of digital wealth management.
Leveraging Spreadsheet Software for Precise Tracking
Excel and Google Sheets are the gold standards for financial tracking. To calculate the percentage change between two numbers in cells A1 (Old) and B1 (New), you would use the formula: = (B1-A1)/A1.
To make this useful for money management, you can create a “Delta” column in your investment tracker. This column automatically calculates the percentage change for every asset in your portfolio. Advanced users can even use “Conditional Formatting” to turn cells green when the percentage increase exceeds a certain threshold (e.g., 5%) or red when it dips, providing an immediate visual dashboard of financial health.
Financial Calculators and AI-Driven Budgeting Apps
Beyond spreadsheets, many specialized tools exist to help with these calculations. Mortgage calculators use percentage-based interest rates to determine long-term costs, while AI-driven apps like Mint or YNAB (You Need A Budget) automatically calculate the percentage of your income spent on various categories.
However, the most successful wealth builders don’t rely solely on the “black box” of an app. They understand the underlying math. When an AI tool tells you that your “Savings Rate” has increased by 15%, you should be able to verify that by looking at your income and savings numbers. This level of oversight ensures that you remain the master of your money, rather than a passive observer of automated data.
Conclusion: The Power of Relative Thinking
Calculating the percentage between two numbers is more than a middle-school math problem; it is a vital financial discipline. It shifts your perspective from absolute dollars to relative growth, enabling you to compare different opportunities, manage risks, and optimize your budget.
By consistently applying these formulas to your investments, debts, and business ventures, you develop a sharper “money sense.” You begin to see the world not in terms of how much things cost, but in terms of what they yield. Whether you are aiming for a 7% annual return on your index funds or a 40% margin on your new business, the humble percentage is the metric that will guide you to financial independence.
aViewFromTheCave is a participant in the Amazon Services LLC Associates Program, an affiliate advertising program designed to provide a means for sites to earn advertising fees by advertising and linking to Amazon.com. Amazon, the Amazon logo, AmazonSupply, and the AmazonSupply logo are trademarks of Amazon.com, Inc. or its affiliates. As an Amazon Associate we earn affiliate commissions from qualifying purchases.