In the world of personal finance and global economics, few indicators carry as much weight as the inflation rate. It is the silent force that dictates the value of the currency in your wallet, the cost of the groceries in your cart, and the ultimate success of your long-term investment strategy. For anyone looking to master their financial future, understanding how to derive this rate from the Consumer Price Index (CPI) is not just a mathematical exercise—it is an essential skill for navigating the modern economy.
This guide will break down the mechanics of the CPI, provide a step-by-step methodology for calculating inflation, and explore how these figures influence your personal wealth management.
Understanding the Consumer Price Index (CPI)
Before diving into the calculations, it is vital to understand the data source. The Consumer Price Index (CPI) is a measure of the average change over time in the prices paid by urban consumers for a market basket of consumer goods and services. It is essentially a temperature check on the cost of living.
What is the “Market Basket”?
Government agencies, such as the Bureau of Labor Statistics (BLS) in the United States, track the prices of thousands of items. These items are categorized into a “market basket” that represents the spending habits of the average household. The basket includes necessities such as housing, food, and energy, as well as discretionary expenses like apparel, recreation, and education. By tracking how the cost of this specific basket changes, economists can estimate the rate at which the value of money is depreciating or appreciating.
The Role of the Base Year
The CPI is an index, meaning it is relative to a specific point in time known as the “base year.” The base year is typically assigned a value of 100. If the CPI is currently 300, it suggests that the cost of the market basket has tripled since the base period. This indexing allows for a standardized comparison across decades, helping investors see the long-term erosion of purchasing power.
The Step-by-Step Guide to Calculating Inflation
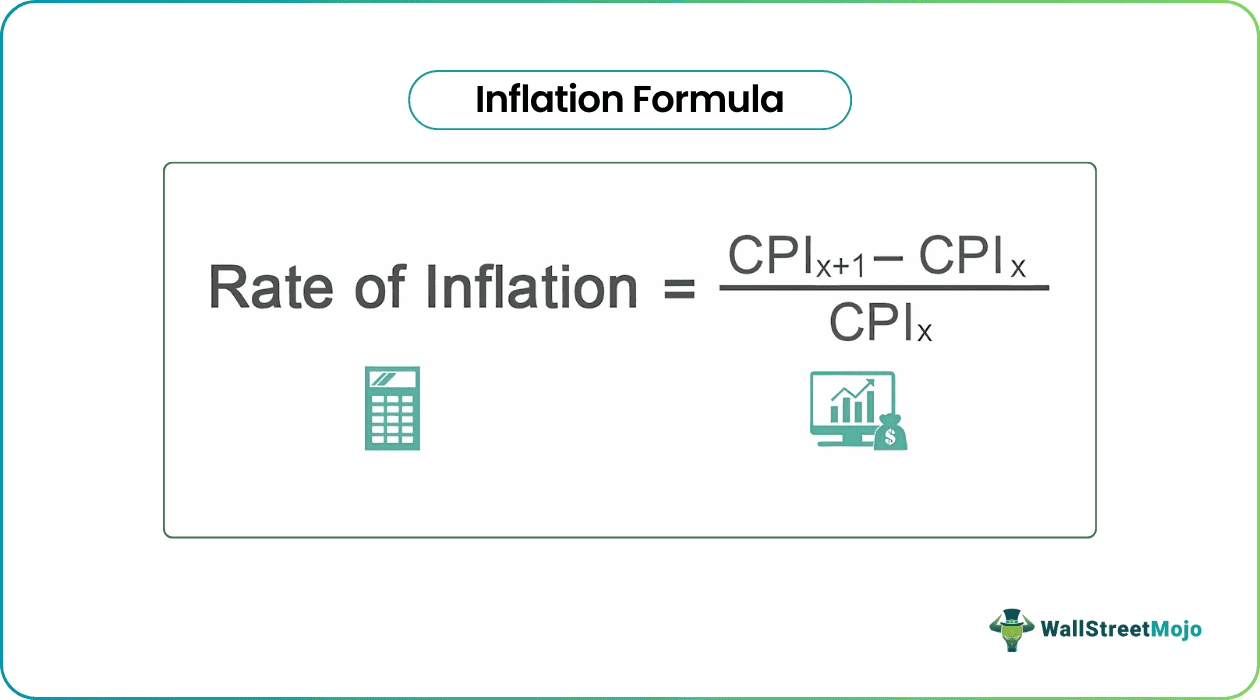
Calculating the inflation rate from CPI figures is a straightforward process once you understand the formula. The inflation rate represents the percentage change in the price index over a specific period, usually a month or a year.
The Core Inflation Formula
To find the inflation rate, you need two data points: the CPI for the current period ($CPI1$) and the CPI for the previous period ($CPI0$). The formula is as follows:
Inflation Rate = [(CPI₁ – CPI₀) / CPI₀] × 100
This calculation yields a percentage. A positive result indicates inflation (rising prices), while a negative result indicates deflation (falling prices).
A Practical Example
Let’s look at a hypothetical scenario to ground the math in reality. Imagine you are evaluating the inflation rate between two years:
- Year A (Previous): CPI = 250
- Year B (Current): CPI = 265
First, subtract the previous CPI from the current CPI:
$265 – 250 = 15$
Next, divide that difference by the previous year’s CPI:
$15 / 250 = 0.06$
Finally, multiply by 100 to get the percentage:
$0.06 times 100 = 6%$

In this example, the annual inflation rate is 6%. This means that, on average, a consumer would need 6% more money to purchase the same goods and services they bought the year prior.
Year-over-Year vs. Month-over-Month
Investors often look at two types of inflation reporting. Month-over-Month (MoM) compares the current month to the immediate previous month, providing a look at short-term volatility. Year-over-Year (YoY) compares the current month to the same month one year ago. For long-term financial planning, YoY is generally considered more useful as it filters out seasonal fluctuations, such as the rise in heating costs during winter or travel spikes during summer.
Why This Calculation Matters for Your Personal Finances
Understanding how to calculate inflation is the first step toward protecting your wealth. Inflation is often described as a “hidden tax” because it reduces the purchasing power of your savings without you ever seeing a deduction from your bank account.
The Erosion of Purchasing Power
If you have $10,000 in a standard savings account earning 0.1% interest, but the inflation rate (calculated from the CPI) is 5%, you are effectively losing money. While your balance is technically increasing, the “real” value of that money is decreasing. In one year, your $10,000 will only buy what $9,500 would have bought at the start of the year. For those in the “Money” niche, recognizing this gap is crucial for determining how much cash to hold versus how much to invest.
Adjusting Your Cost of Living
For professionals and business owners, the CPI-based inflation rate is a vital tool for negotiations. If your annual salary increase is 3%, but the CPI shows an inflation rate of 4%, you have actually received a pay cut in terms of purchasing power. Knowing how to calculate these figures empowers individuals to advocate for Cost of Living Adjustments (COLA) that keep pace with the actual economy.
Strategic Investing in an Inflationary Environment
In the world of finance, inflation isn’t just a hurdle; it’s a variable that dictates asset allocation. Once you can interpret CPI trends, you can adjust your portfolio to mitigate risks.
Real vs. Nominal Returns
The “nominal return” is the percentage gain you see on your investment statement. The “real return” is the nominal return minus the inflation rate. For example, if your stock portfolio returns 8% in a year where inflation is 3%, your real return is 5%. Successful investors focus on maximizing real returns. If inflation begins to spike, as evidenced by a rising CPI, investors may shift away from fixed-income assets (like traditional bonds), which lose value as inflation rises, and toward assets that historically hedge against inflation.
Inflation-Protected Securities and Hard Assets
When the CPI trend is consistently upward, certain financial tools become more attractive. Treasury Inflation-Protected Securities (TIPS) are government bonds specifically designed to increase in value as the CPI rises. Similarly, “hard assets” like real estate and commodities often appreciate alongside inflation. Because real estate is often financed with fixed-rate debt, inflation can actually benefit the borrower, as they are paying back loans with “cheaper” dollars while the property value and rent prices rise with the CPI.
Interpreting Variations: Core CPI vs. Headline CPI
Not all CPI reports are created equal. When you read financial news or analyze government data, you will often encounter two different figures: Headline CPI and Core CPI. Understanding the difference is key to advanced financial planning.
The Volatility of Food and Energy
Headline CPI includes every category in the market basket. However, food and energy prices (like gas and electricity) are notoriously volatile and subject to geopolitical shocks or weather events that don’t necessarily reflect the broader trend of the economy.
Why Economists Prefer Core CPI
Core CPI strips out food and energy to provide a clearer picture of the underlying inflation trend. For a long-term investor, Core CPI is often a better “signal” than the “noise” of Headline CPI. If Core CPI is rising, it suggests that inflation is becoming “sticky”—meaning it is becoming embedded in services, housing, and manufactured goods. This often signals that central banks (like the Federal Reserve) may raise interest rates, which can lead to volatility in the stock and bond markets.

Conclusion: Mastering the Math of Money
The ability to calculate the inflation rate from the CPI is more than just a statistical trick; it is a foundational pillar of financial literacy. By monitoring the CPI, calculating the percentage change, and understanding the difference between nominal and real gains, you can make more informed decisions about your savings, your career, and your investments.
In an era of economic uncertainty, those who understand the math behind the money are best equipped to preserve their purchasing power. Whether you are adjusting your monthly budget or rebalancing a multi-million dollar portfolio, the CPI remains your most reliable compass in the journey toward financial independence. Always remember: it’s not just about how much money you make, but how much that money can actually buy.
aViewFromTheCave is a participant in the Amazon Services LLC Associates Program, an affiliate advertising program designed to provide a means for sites to earn advertising fees by advertising and linking to Amazon.com. Amazon, the Amazon logo, AmazonSupply, and the AmazonSupply logo are trademarks of Amazon.com, Inc. or its affiliates. As an Amazon Associate we earn affiliate commissions from qualifying purchases.