Understanding “how the stock market is doing today” requires more than a glance at a green or red ticker on a smartphone screen. For the modern investor, the daily movement of the markets is a complex tapestry woven from macroeconomic data, corporate earnings, geopolitical shifts, and investor psychology. While the headlines often focus on the immediate gains or losses of major indices, a professional analysis looks deeper into the underlying health of the financial ecosystem to determine whether current trends are a fleeting “noise” or a significant “signal.”
In this comprehensive analysis, we will deconstruct the mechanics of today’s market performance, the drivers behind the volatility, and how you can interpret these movements to strengthen your personal financial strategy.
Decoding Today’s Market Indicators: More Than Just Numbers
When people ask how the market is performing, they are usually referring to the “Big Three” indices. However, these indices measure very different things, and their performance today can tell vastly different stories about the state of the economy.
The Major Indices: S&P 500, Dow, and Nasdaq
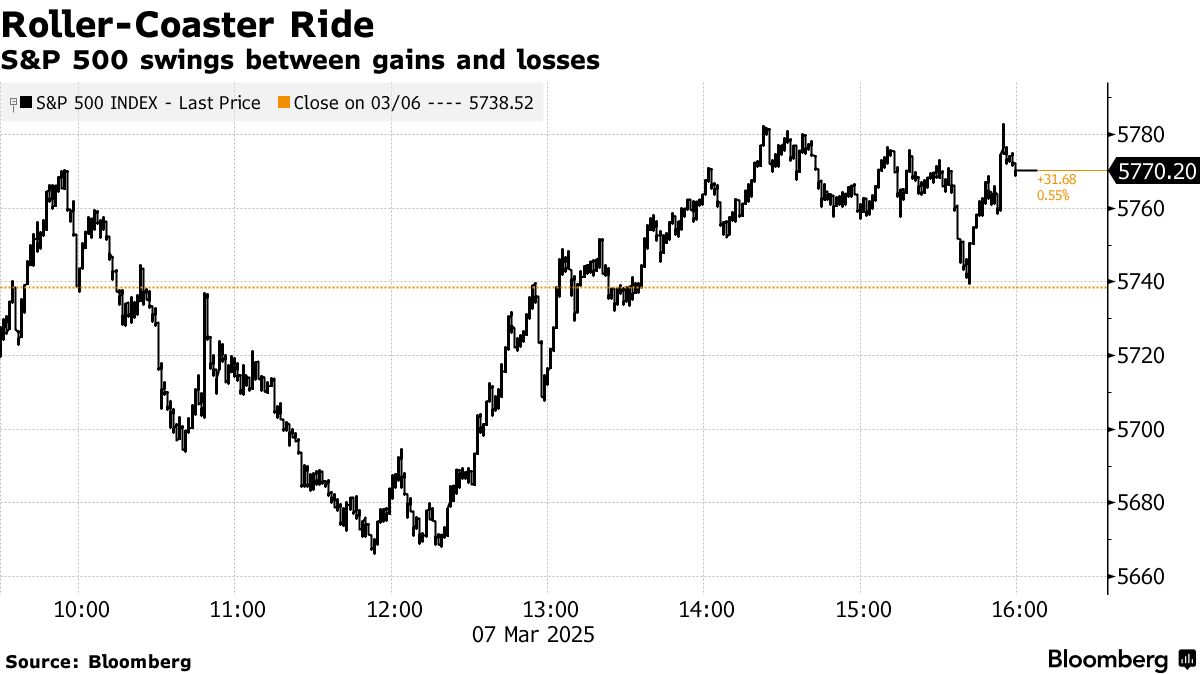
The S&P 500 is widely considered the most accurate reflection of the U.S. economy, tracking 500 of the largest publicly traded companies. Because it is market-capitalization weighted, today’s performance is heavily influenced by “mega-cap” stocks. If the S&P 500 is up while other indices are down, it often suggests that a few large-scale leaders are carrying the weight of the market.
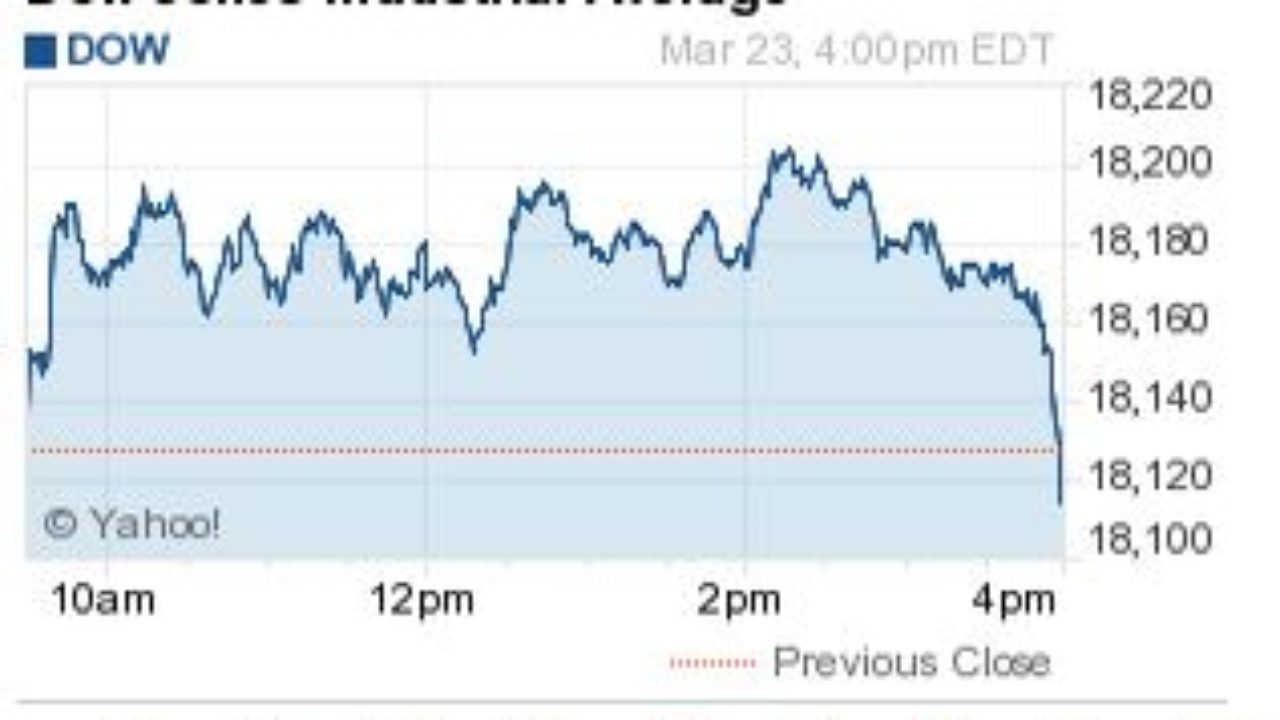
The Dow Jones Industrial Average (DJIA), by contrast, is a price-weighted index of 30 blue-chip companies. It offers a glimpse into the health of “Old Economy” sectors like manufacturing, banking, and retail. Finally, the Nasdaq Composite is tech-heavy. On days when the Nasdaq outperforms, it typically indicates a high appetite for risk and growth-oriented investments, often driven by optimism in sectors like Artificial Intelligence or semiconductors.
Market Sentiment and the VIX
To understand the “vibe” of today’s market, professionals look at the CBOE Volatility Index (VIX), often called the “Fear Gauge.” If the market is down and the VIX is spiking, it indicates a high level of uncertainty and potential panic. Conversely, a low VIX during a steady market climb suggests investor complacency. Monitoring the VIX alongside price action helps investors distinguish between a healthy correction and a systemic sell-off.
Economic Data Releases: The Catalyst for Movement
Often, the reason the market is moving “today” is tied to a specific data release. The Bureau of Labor Statistics and the Federal Reserve frequently release reports on the Consumer Price Index (CPI), unemployment rates, and manufacturing output. In the current economic climate, “bad news” for the economy (like a slight rise in unemployment) can sometimes be “good news” for the stock market, as it may signal that the Federal Reserve will lower interest rates to stimulate growth.
Key Drivers of Current Market Performance
The stock market does not move in a vacuum. Its daily fluctuations are the result of several powerful engines working in tandem or in opposition.
Interest Rates and the Federal Reserve’s Stance
Perhaps no single factor influences today’s market more than the cost of money. The Federal Reserve’s decisions on interest rates dictate the “risk-free rate” of return. When interest rates are high, bonds become more attractive relative to stocks, and the cost of borrowing for corporations increases, which can squeeze profit margins. Today’s market performance is often a direct reaction to the “Fed Speak”—public comments made by central bank officials regarding their outlook on inflation and future rate hikes or cuts.
Corporate Earnings Seasonality
Four times a year, the market enters “Earnings Season.” During these windows, today’s market direction is almost entirely dictated by whether companies are meeting, exceeding, or missing their quarterly profit goals. However, it isn’t just the past quarter’s numbers that matter; “guidance”—the company’s forecast for the next six months—is often the primary driver of a stock’s immediate price action. Even if a company reports record profits, its stock may fall today if the CEO expresses caution about future consumer spending.
Geopolitical Events and Global Supply Chains
In a globalized financial system, an event across the ocean can dictate the direction of the New York Stock Exchange. Energy prices, dictated by geopolitical stability in the Middle East or Eastern Europe, directly impact the transportation and manufacturing sectors. When energy costs rise, it acts as a “tax” on both corporations and consumers, often leading to a bearish (downward) trend in the broader market.
Interpreting Market Trends for Different Investor Profiles
How you react to today’s market performance should depend entirely on your financial goals, time horizon, and risk tolerance. A “bad day” for a day trader might be a “buying opportunity” for a retirement saver.
Strategies for the Long-Term Investor
For those investing for goals ten or twenty years away, such as retirement or a child’s education, today’s market performance is largely irrelevant to the final outcome. In fact, professional wealth managers often advise against checking the “daily pulse” too frequently. Historically, the stock market has returned an average of 7-10% annually over long periods. For the long-term investor, the best strategy during a down market is often “Dollar Cost Averaging”—continuing to invest a set amount of money at regular intervals, regardless of whether the market is up or down.
Tactical Considerations for the Active Trader
Active traders operate on a different frequency. For them, “how the market is doing today” is about identifying patterns, liquidity, and momentum. They utilize technical analysis to find entry and exit points. If the market is “sideways” (trading within a tight range), an active trader might look for breakout opportunities. If the market is trending strongly in one direction, they may look to “trade the trend.” For this group, today’s market is a puzzle to be solved for short-term gains.
Managing Risk in a Fluctuating Environment
Regardless of your profile, risk management is the cornerstone of successful investing. This involves “Rebalancing”—the process of selling assets that have performed exceptionally well and buying those that have underperformed to maintain your desired asset allocation. If the market has been on a bull run (upward trend) for several weeks, your portfolio might become “overweighted” in stocks. A professional approach involves trimming those gains to ensure a single market downturn today doesn’t wipe out your long-term progress.
Tools and Metrics for Real-Time Analysis
To move beyond the headlines, investors use specific financial tools to gauge the “internal” strength of the market. These metrics provide a more granular look at what is actually happening beneath the surface.
Relative Strength Index (RSI) and Moving Averages
Technical metrics like the RSI help investors determine if the market is “overbought” or “oversold.” If the RSI for the S&P 500 is above 70, it suggests that prices may have risen too far, too fast, and a pullback might be imminent. Similarly, looking at the 200-day Moving Average helps determine the long-term trend. If the market is “doing well today” but is still trading below its 200-day average, we may still be in a bear market (long-term decline) despite a short-term rally.
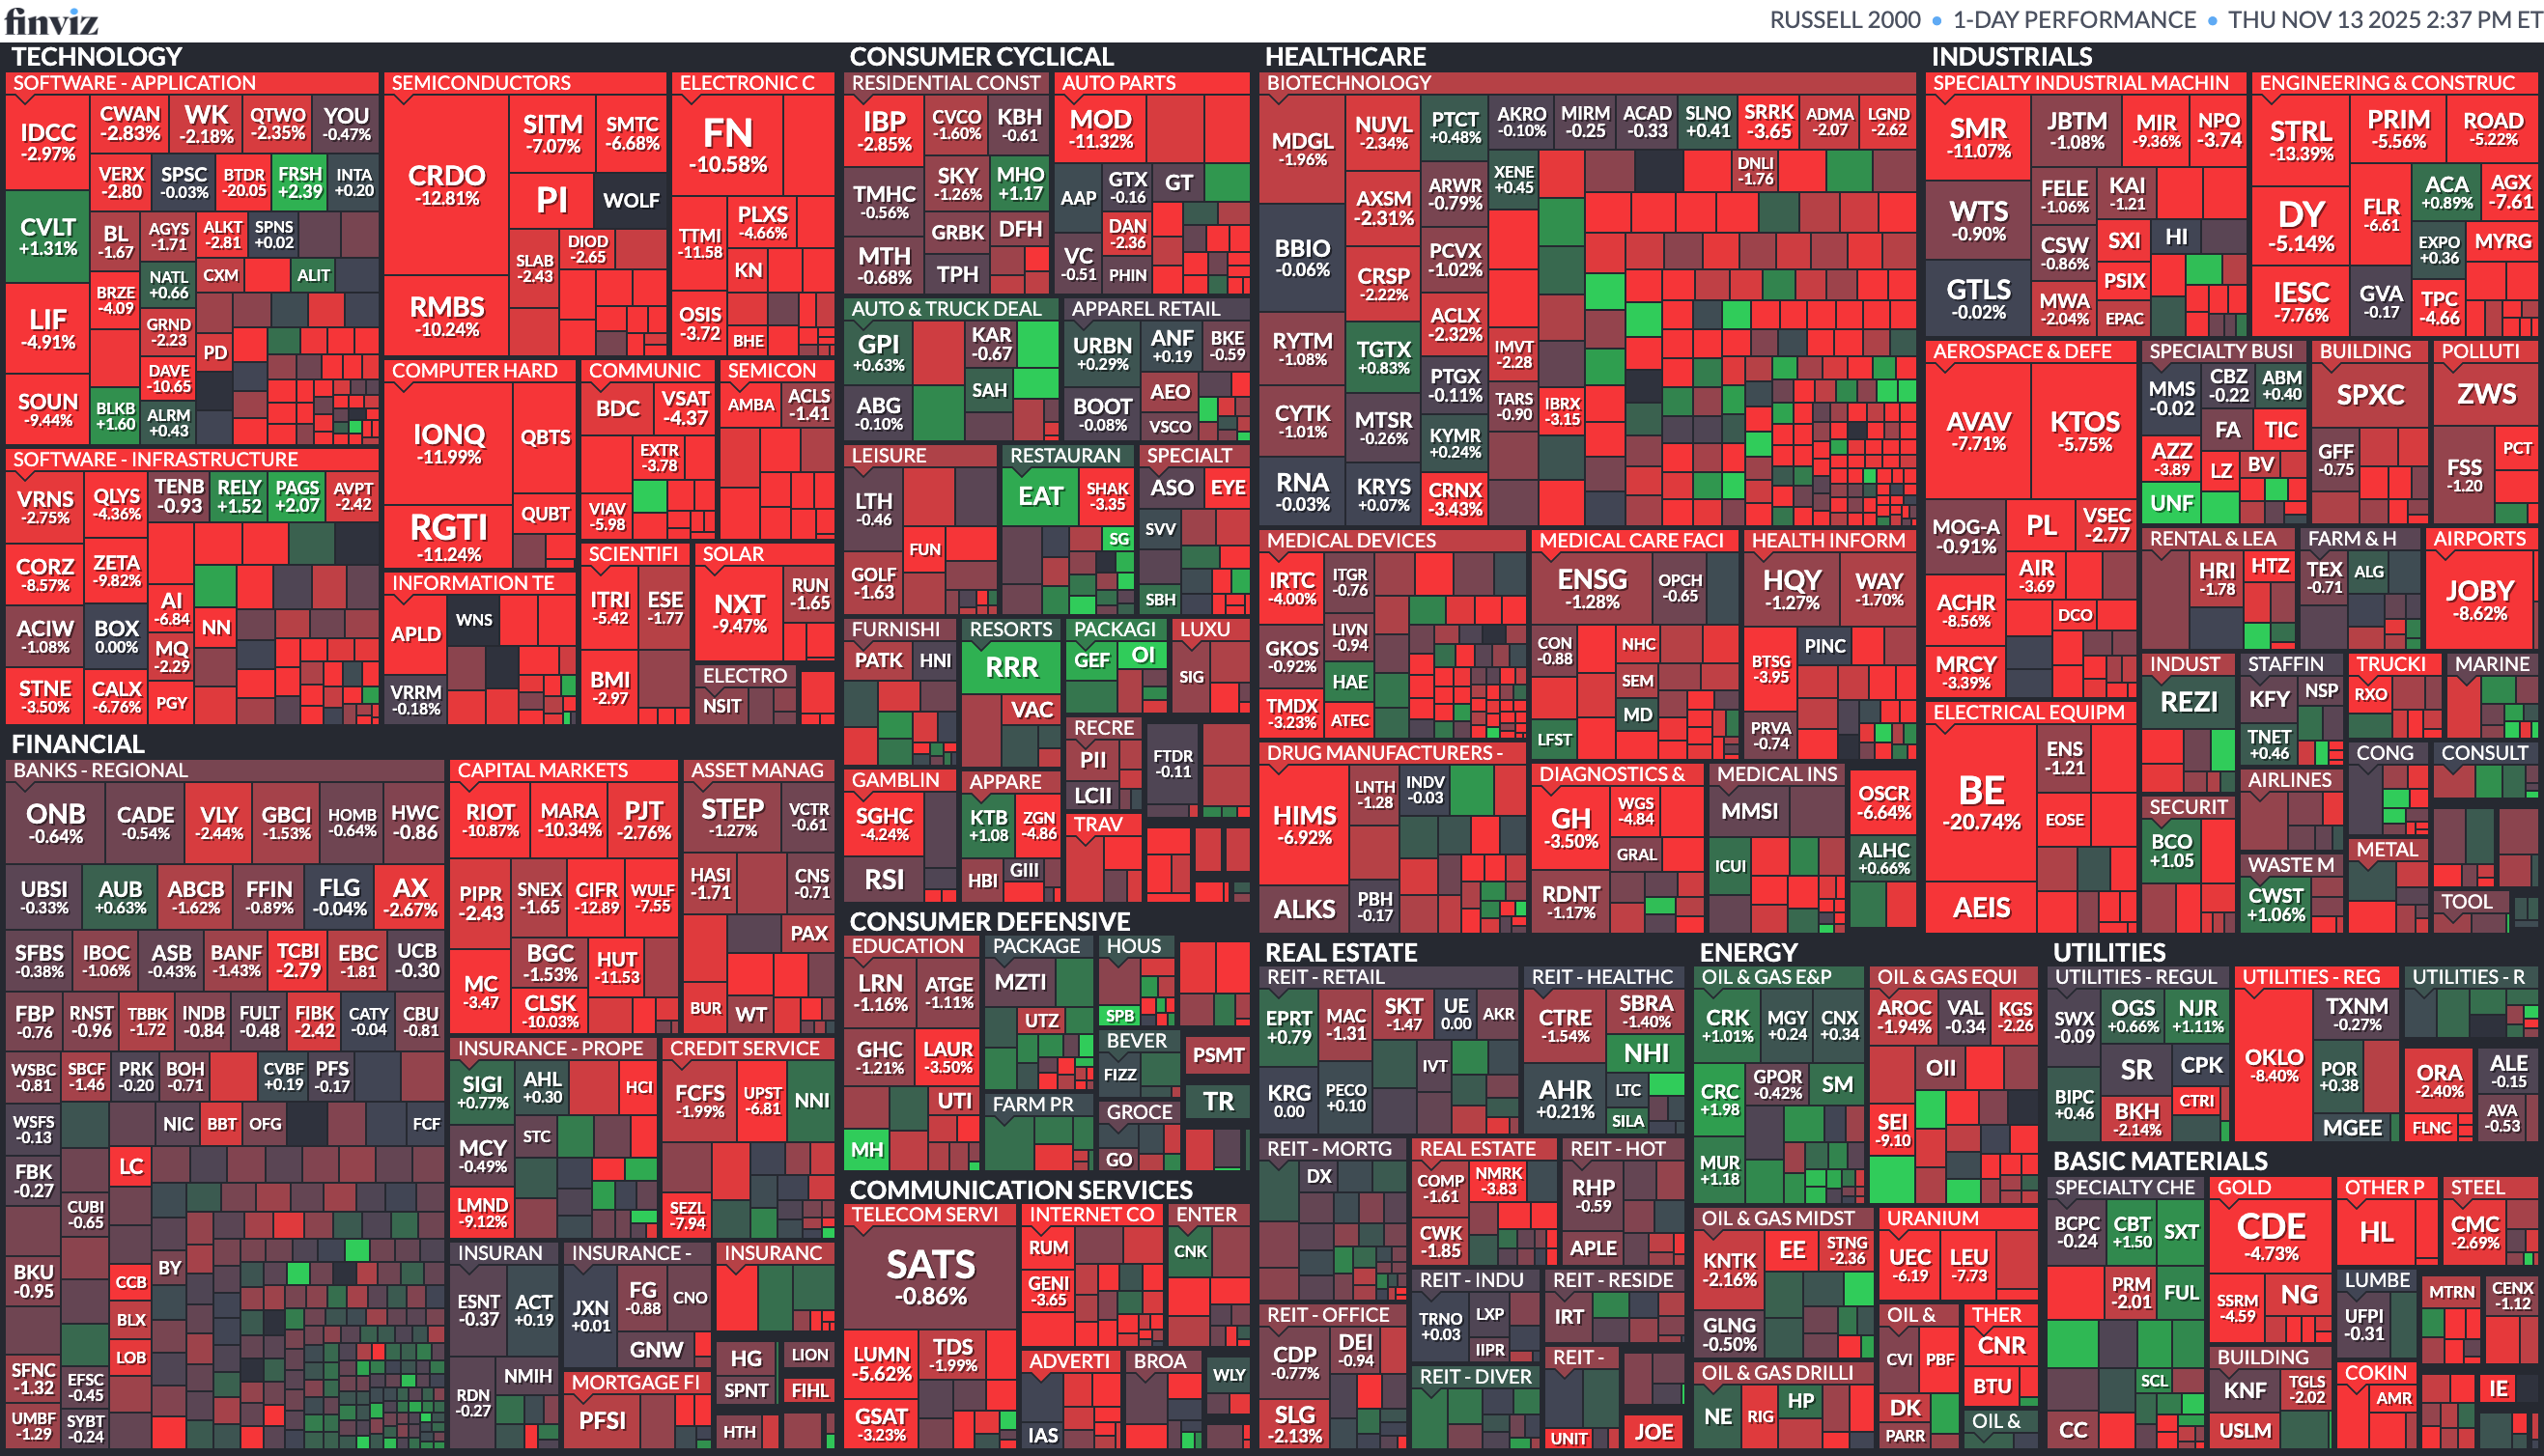
Sector Rotation Analysis
The market is divided into eleven sectors, including Technology, Healthcare, Energy, and Utilities. Sometimes the “market” is flat, but a look under the hood reveals that investors are rotating out of “Cyclical” stocks (those that do well when the economy is booming) and into “Defensive” stocks (like utilities or consumer staples). This rotation is a subtle signal that big institutional investors are preparing for an economic slowdown, providing a hint about where the market might be headed in the coming months.
Dividend Yields and Fundamental Valuation
For the value-oriented investor, today’s market is analyzed through the lens of the Price-to-Earnings (P/E) Ratio. If the market is “up” but P/E ratios are at historic highs, it suggests the market may be overvalued. On the other hand, if the market is “down” but dividend yields are rising, it may represent a high-quality opportunity to lock in passive income at a discount.
The Psychological Aspect of Market Fluctuations
Ultimately, the stock market is a reflection of human emotion—specifically, the tug-of-war between fear and greed. Understanding the psychology behind today’s numbers is crucial for maintaining a disciplined financial plan.
Avoiding Emotional Decision Making
The biggest threat to an investor’s wealth is not a market crash, but their own reaction to it. When the market is “doing poorly today,” the natural human instinct is to sell to prevent further loss (Loss Aversion). Conversely, when the market is “doing great,” people often jump in late due to the Fear of Missing Out (FOMO). Professional investing requires a “systematized” approach—having a set of rules that dictate your actions so that you don’t make permanent mistakes based on temporary market moods.
The Importance of Diversified Asset Allocation
The best defense against a volatile market day is a diversified portfolio. Diversification doesn’t just mean owning different stocks; it means owning different types of assets, such as bonds, real estate, and commodities. When the stock market is struggling today, other assets like gold or Treasury bonds often act as a hedge, rising in value as investors seek safety. A well-constructed portfolio ensures that “how the market is doing today” never dictates “how your financial future is doing tomorrow.”
Conclusion: The Big Picture
The question of “how the stock market is doing today” is a gateway to understanding the broader economic landscape. While daily fluctuations provide the excitement and the headlines, the true power of the market lies in its long-term ability to build wealth through compound interest and corporate growth. By looking past the immediate numbers and focusing on interest rates, corporate health, and disciplined risk management, you can transform from a passive observer of the market into a strategic participant in your own financial destiny. Remember: the market is a tool for building wealth, not a game to be won in a single day.
aViewFromTheCave is a participant in the Amazon Services LLC Associates Program, an affiliate advertising program designed to provide a means for sites to earn advertising fees by advertising and linking to Amazon.com. Amazon, the Amazon logo, AmazonSupply, and the AmazonSupply logo are trademarks of Amazon.com, Inc. or its affiliates. As an Amazon Associate we earn affiliate commissions from qualifying purchases.