Inflation is a pervasive economic phenomenon that touches the lives of every individual and influences the decisions of governments, businesses, and investors worldwide. In its simplest form, inflation refers to the rate at which the general level of prices for goods and services is rising, and, consequently, the purchasing power of currency is falling. Understanding how this crucial economic indicator is calculated is not merely an academic exercise; it provides essential insights into economic health, informs monetary policy, shapes investment strategies, and impacts personal financial planning. Without a precise method for calculating inflation, economists and policymakers would be navigating a complex financial landscape in the dark, unable to make informed decisions about interest rates, wage adjustments, or fiscal spending. This article delves into the methodologies and key metrics used to calculate the inflation rate, illuminating the intricate process that transforms vast amounts of price data into a single, telling percentage.
Understanding the Foundation of Inflation Measurement
Before diving into the complex calculations, it’s vital to grasp the core concepts that underpin inflation measurement. Inflation isn’t about the price increase of a single item; it reflects a broad upward movement across a wide array of goods and services.
Defining Inflation and Its Economic Significance
At its heart, inflation signifies a reduction in the purchasing power of money. If a basket of goods costs $100 today and $105 next year, inflation has occurred, meaning your $100 buys less than it did before. This seemingly simple concept has profound economic implications. Persistent high inflation can erode savings, reduce real wages, and create economic uncertainty, discouraging investment and long-term planning. Conversely, deflation (a general decline in prices) can also be detrimental, leading to reduced consumer spending, lower corporate profits, and increased unemployment. Therefore, central banks typically aim for a stable, low rate of inflation, often around 2%, considering it conducive to healthy economic growth and stability. The precise calculation of this rate allows policymakers to gauge whether the economy is overheating or contracting, guiding their decisions on interest rates and other monetary tools.
The Concept of a “Basket of Goods and Services”
To measure inflation accurately, economists employ the concept of a “basket of goods and services.” This theoretical basket represents the typical consumption patterns of a specific demographic, usually urban consumers. It includes a wide variety of items such as food, housing, transportation, medical care, education, and apparel. The selection of items in this basket is crucial; it must be representative of what people actually buy. Statistical agencies regularly update the composition and weighting of this basket to reflect changing consumer habits and the introduction of new products. For instance, as technology evolves, items like smartphones or internet services might be added, while less relevant items might be removed or have their weights adjusted. This dynamic approach ensures that the inflation calculation remains relevant and reflective of real-world spending.
Key Metrics for Measuring Price Changes
Several indices are used globally to calculate inflation, each offering a slightly different perspective on price movements. The most prominent among these are the Consumer Price Index (CPI), the Producer Price Index (PPI), and the Personal Consumption Expenditures (PCE) Price Index.
The Consumer Price Index (CPI)
The Consumer Price Index (CPI) is perhaps the most widely recognized and frequently cited measure of inflation. Calculated by national statistical agencies (like the Bureau of Labor Statistics in the U.S. or the Office for National Statistics in the UK), the CPI tracks the average change over time in the prices paid by urban consumers for a market basket of consumer goods and services. Data collectors regularly survey thousands of households about their spending habits and collect millions of price quotes from retail outlets across a wide geographical area.
The CPI is calculated by:
- Surveying Prices: Collecting prices for the hundreds of goods and services in the consumer basket each month.
- Calculating the Basket’s Cost: Summing up the weighted costs of all items in the basket for the current period and a chosen base period.
- Determining the Index: Dividing the current basket cost by the base period basket cost and multiplying by 100.
- Calculating Inflation: The inflation rate is then the percentage change in the CPI from one period (e.g., month or year) to another.
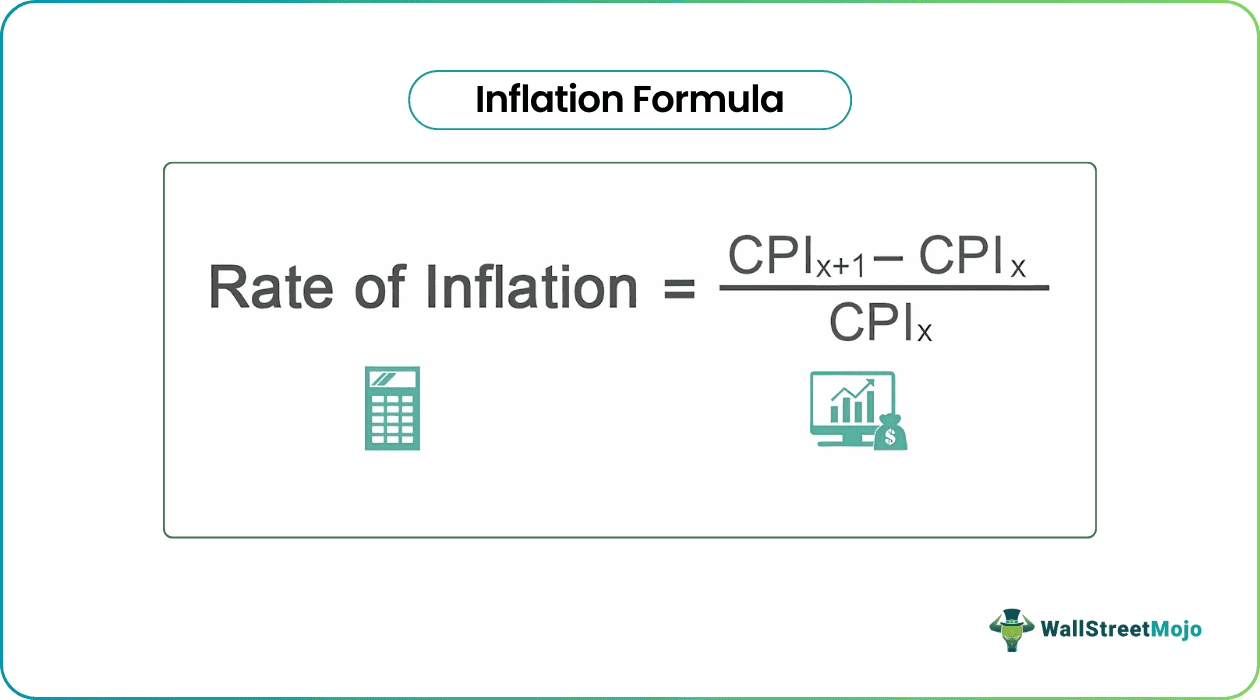
The formula for the annual CPI inflation rate is:
((CPI in Current Year – CPI in Previous Year) / CPI in Previous Year) * 100
Producer Price Index (PPI) and Personal Consumption Expenditures (PCE)
While CPI focuses on the consumer’s perspective, the Producer Price Index (PPI) measures the average change over time in the selling prices received by domestic producers for their output. It essentially tracks prices at the wholesale level before they reach consumers. The PPI is often seen as an early indicator of inflationary pressures, as increases in producer prices can eventually be passed on to consumers. It covers goods, services, and construction.
The Personal Consumption Expenditures (PCE) Price Index, produced by the Bureau of Economic Analysis (BEA) in the U.S., is another crucial measure, particularly favored by the Federal Reserve for its monetary policy decisions. Unlike the CPI, which measures what households directly spend out-of-pocket, the PCE broader in scope. It includes not only direct household expenditures but also expenditures made on behalf of households by non-profit institutions and employers (e.g., healthcare benefits). The PCE also uses a chained index method, which allows for more frequent updates to the weights of goods and services, making it less prone to substitution bias than the CPI (where consumers might substitute cheaper goods for more expensive ones). These methodological differences often result in the PCE showing a slightly lower inflation rate than the CPI.
The Methodology Behind Inflation Rate Calculation
The core principle behind calculating the inflation rate involves comparing the cost of a fixed set of goods and services at two different points in time. This is done through a rigorous process involving data collection, weighting, and index computation.
Weighting and the Base Period
A critical aspect of inflation calculation is weighting. Not all goods and services in the basket are equally important to the average household budget. For example, housing costs typically constitute a much larger portion of spending than, say, the cost of fresh fruit. Therefore, each item in the basket is assigned a “weight” corresponding to its relative importance in consumer spending. These weights are derived from extensive consumer expenditure surveys and are periodically updated to reflect changes in spending patterns.
The calculation also relies on a “base period,” which is a specific year or period chosen as a benchmark. The price index for the base period is typically set to 100. All subsequent price changes are then measured against this base. For instance, if the CPI in the base year (say, 2000) was 100, and in 2023 it is 130, it indicates a 30% increase in prices over that period. The careful selection and consistent application of weights and base periods are essential for generating accurate and comparable inflation figures over time.
The Inflation Rate Formula and Its Nuances

The general formula for calculating the inflation rate, regardless of the specific index (CPI, PPI, or PCE), is the percentage change between the index values of two different periods.
For example, to calculate the annual inflation rate using the CPI:
Inflation Rate = ((CPICurrentPeriod – CPIPreviousPeriod) / CPIPreviousPeriod) * 100
Where:
- CPICurrentPeriod is the Consumer Price Index for the current period (e.g., January 2024).
- CPIPreviousPeriod is the Consumer Price Index for the immediately preceding period (e.g., January 2023 for annual inflation, or December 2023 for monthly inflation).
This formula yields a positive percentage for inflation (prices rising) and a negative percentage for deflation (prices falling). Nuances arise from how often indices are updated, how substitution effects are accounted for, and how quality improvements in goods and services are handled. For example, if a new smartphone model is significantly more powerful than its predecessor but costs the same, its “effective price” might be considered to have fallen due to improved quality, which statistical agencies attempt to account for through hedonic adjustments.
Different Measures and Their Policy Implications
The choice of inflation measure can have significant policy implications, as different indices might tell slightly different stories about the economy. This has led to the development of various refined measures to provide a clearer picture.
Headline vs. Core Inflation
Economists often differentiate between “headline inflation” and “core inflation.” Headline inflation refers to the raw, unadjusted inflation rate as calculated by the CPI or PCE, encompassing all goods and services in the basket. While it represents the overall cost of living, headline inflation can be highly volatile due to fluctuating prices of specific items.
“Core inflation,” on the other hand, excludes volatile components such as food and energy prices. Food and energy prices are particularly susceptible to short-term shocks, like weather events impacting harvests or geopolitical tensions affecting oil supply. By removing these volatile elements, core inflation provides a clearer signal of underlying, long-term inflationary trends in the economy. Central banks, like the Federal Reserve, often pay closer attention to core inflation when making monetary policy decisions, as it better reflects sustained price pressures rather than temporary fluctuations.
Annual vs. Monthly vs. Quarterly Inflation
Inflation can be reported over various timeframes, each providing different insights:
- Monthly Inflation: Measures the percentage change in prices from one month to the next. This is useful for identifying immediate price trends but can be very volatile.
- Quarterly Inflation: Measures the percentage change over a three-month period, offering a slightly smoother trend than monthly data.
- Annual Inflation (Year-over-Year): This is the most common and often cited measure, comparing prices in a given month to the same month in the previous year. It smooths out seasonal variations and provides a more stable indicator of long-term price trends. It’s also known as the 12-month percentage change.
- Annualized Inflation: This takes a shorter-term inflation rate (e.g., monthly or quarterly) and projects what it would be if it continued for a full year. For example, a monthly inflation rate of 0.3% might be annualized to roughly 3.6% (0.3% * 12). While useful for contextualizing short-term data, it assumes the trend will continue, which may not always be accurate.
These different temporal measures allow analysts to assess both the immediate trajectory of prices and the broader, sustained inflationary environment.
The Impact and Importance of Inflation Data
The meticulous calculation and ongoing monitoring of inflation rates are not merely statistical exercises; they are fundamental to economic stability, policy formulation, and individual financial well-being. Inflation data serves as a critical compass for navigating complex economic currents.
Guiding Monetary and Fiscal Policy
Central banks around the world, such as the U.S. Federal Reserve, the European Central Bank, and the Bank of England, use inflation data as a primary input for setting monetary policy. Their mandates often include maintaining price stability, typically defined as a target inflation rate (e.g., 2%). If inflation is consistently above target, the central bank might raise interest rates to cool down the economy and curb spending, thereby reducing price pressures. Conversely, if inflation is too low or negative (deflation), they might lower interest rates or implement quantitative easing to stimulate economic activity and encourage inflation.
Governments also use inflation data to inform fiscal policy decisions. For example, pension adjustments, social security benefits, and tax brackets are often indexed to inflation to ensure that the real value of these payments and thresholds is maintained over time. Without accurate inflation figures, these vital governmental functions would be poorly calibrated, leading to social and economic inequities.

Impact on Personal Finance and Investment Strategies
For individuals, understanding inflation calculations directly impacts personal finance. Inflation erodes the purchasing power of savings, meaning that money held in accounts with low interest rates effectively loses value over time. Savers need to seek investments that offer returns higher than the inflation rate to maintain or grow their real wealth.
Inflation also influences investment strategies. In periods of high inflation, investors might gravitate towards inflation-protected securities (like TIPS), real estate, commodities, or dividend-paying stocks that can potentially offer a hedge against rising prices. Debt, conversely, can become cheaper in real terms during inflationary periods, as the fixed payments represent a smaller portion of future inflated income. Wage negotiations are also deeply tied to inflation; workers often seek wage increases that at least match the inflation rate to preserve their real income. Therefore, the calculated inflation rate acts as a benchmark for countless financial decisions, from budgeting and saving to borrowing and investing.
In conclusion, the calculation of the inflation rate is a sophisticated and dynamic process, involving the meticulous collection of price data, the construction of representative baskets of goods and services, and the application of complex statistical methodologies. Whether through the lens of CPI, PPI, or PCE, these calculations provide indispensable insights into the economy’s pulse. Far from being an abstract economic concept, a well-understood inflation rate empowers policymakers to steer the economy, businesses to plan for the future, and individuals to make informed financial choices, safeguarding their purchasing power in an ever-evolving economic landscape.
aViewFromTheCave is a participant in the Amazon Services LLC Associates Program, an affiliate advertising program designed to provide a means for sites to earn advertising fees by advertising and linking to Amazon.com. Amazon, the Amazon logo, AmazonSupply, and the AmazonSupply logo are trademarks of Amazon.com, Inc. or its affiliates. As an Amazon Associate we earn affiliate commissions from qualifying purchases.