In the realm of personal and business finance, numbers are the pulse of progress. Whether you are tracking the growth of a retirement portfolio, evaluating a year-end salary bump, or measuring the quarterly revenue of a startup, understanding how to calculate a percentage increase is a fundamental skill. It is the bridge between raw data and actionable insight.
Percentage increase tells you more than just how much a value has changed; it tells you the magnitude of that change relative to where you started. A $10,000 gain is impressive if your initial investment was $20,000, but it is less significant if your starting capital was $1,000,000. By mastering this calculation, you gain the ability to compare different financial opportunities on an equal playing field.
The Fundamental Formula of Financial Progress
Before diving into complex investment strategies or business analytics, one must master the basic arithmetic of growth. The percentage increase formula is a three-step process that allows you to quantify the change between two points in time.
The Step-by-Step Calculation
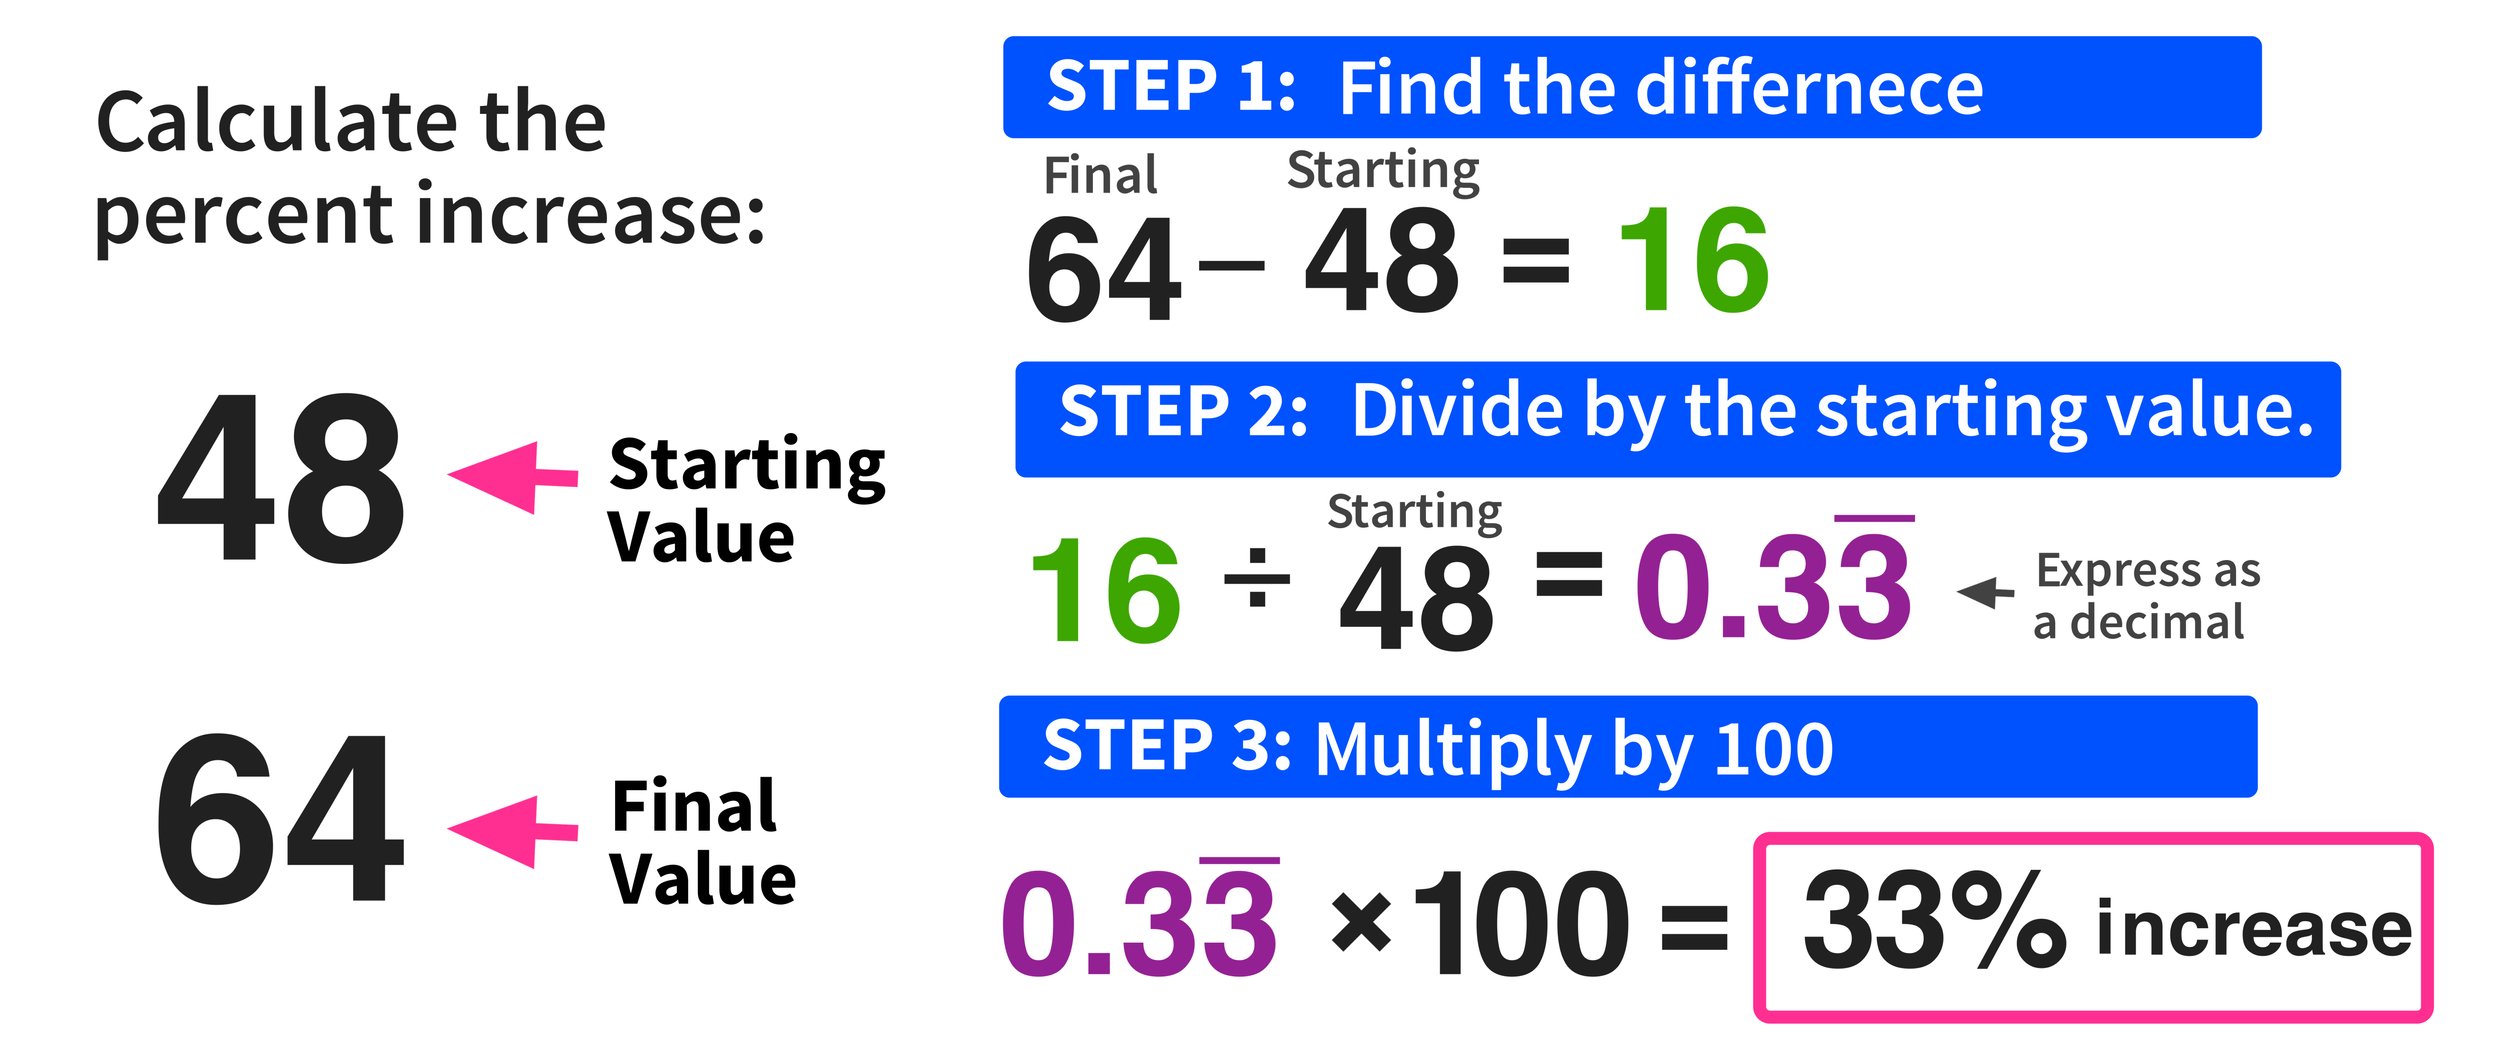
To figure out the percentage increase between two numbers, you need the original value (the starting point) and the new value (the ending point). The formula is as follows:
- Find the Difference: Subtract the original value from the new value. (New Value – Original Value = Increase).
- Divide by the Original: Divide that increase by the original value. (Increase / Original Value).
- Convert to Percentage: Multiply the result by 100 to get the percentage.
For example, if you purchased a share of a tech company at $150 and it is now trading at $195, the calculation would look like this:
- $195 – $150 = $45 (The absolute increase)
- $45 / $150 = 0.3
- 0.3 x 100 = 30%
In this scenario, your investment has seen a 30% increase. This percentage is a vital metric because it allows you to compare the performance of this stock against other assets, regardless of their individual price points.
Understanding “The Delta” in Financial Terms
In the world of finance, the absolute difference between two numbers is often referred to as “the delta.” While the delta tells you the dollar amount of your profit or loss, the percentage increase provides context.
Understanding this distinction is crucial for budgeting. If your monthly utility bill increases from $100 to $120, the delta is only $20. However, that represents a 20% increase in that specific line item. If your total income only increased by 3% in the same period, your “purchasing power” for utilities is shrinking. Tracking these percentages across your various expenses helps you identify where your money is leaking and where you need to adjust your financial strategy.
Measuring Investment Performance and Portfolio Growth
For investors, the percentage increase is the primary yardstick for success. It is the core component of calculating Return on Investment (ROI), and it helps determine whether an asset is outperforming the broader market.
Calculating ROI on Stocks and Real Estate
When you evaluate the performance of an investment, you must look at the capital appreciation over time. In the stock market, this is straightforward: you compare the purchase price to the current market value. However, in real estate, the calculation often involves more variables, though the core percentage increase formula remains the same.
Suppose you bought a rental property for $300,000 and, five years later, it is appraised at $450,000. The percentage increase in the property value is 50%. This figure is essential when deciding whether to hold the asset or sell it to reinvest the capital elsewhere. If the stock market grew by 70% during that same five-year window, your 50% real estate gain—while positive—actually represents an “opportunity cost” loss relative to the market.
The Difference Between Simple and Compound Growth
While a simple percentage increase measures growth between two specific dates, seasoned investors also look at the Annualized Percentage Increase. This is vital because time is a factor in money management.

A 100% increase over ten years is very different from a 100% increase over two years. The former represents a steady, moderate climb, while the latter represents explosive growth. When comparing different financial tools, such as high-yield savings accounts versus index funds, always look at the percentage increase within a defined timeframe to ensure you are making an “apples-to-apples” comparison.
Applying Percentage Increase to Personal Income and Career Benchmarking
In your professional life, the percentage increase is the most powerful tool you have during salary negotiations and performance reviews. It moves the conversation away from “I want more money” to “I have increased my value by X percent.”
Evaluating Salary Increases and Bonus Structures
When you receive a raise, the dollar amount can be deceptive. A $5,000 raise feels different depending on your current base. If you earn $50,000, a $5,000 raise is a 10% increase—a significant jump that usually indicates a promotion or high performance. If you earn $200,000, that same $5,000 is only a 2.5% increase, which might not even keep pace with the rising cost of living.
By calculating the percentage increase of your salary offers, you can better negotiate your worth. If you are moving to a new company, financial experts often suggest aiming for a 15% to 20% increase in total compensation to justify the risk of changing roles.
Inflation vs. Pay Raises: Measuring Real Purchasing Power
One of the most critical applications of this math in personal finance is comparing your income growth against inflation. Inflation is essentially the percentage increase in the cost of goods and services over time, measured by the Consumer Price Index (CPI).
If the annual inflation rate is 5% and your boss gives you a 3% raise, you have actually experienced a “real” pay cut of 2% in terms of purchasing power. Even though the number on your paycheck increased, the percentage increase of your costs outpaced the percentage increase of your income. Understanding this allows you to make more informed decisions about your lifestyle, savings rate, and when to ask for a more substantial cost-of-living adjustment.
Business Finance: Tracking Revenue and Profit Margins
For business owners and entrepreneurs, percentage increase is the ultimate “health check” for the company. It is used to track growth, manage expenses, and report to stakeholders.
Year-over-Year (YoY) Growth Metrics
In business, seasonality can make monthly data misleading. A retail store might see a 50% increase in sales in December compared to November, but that doesn’t necessarily mean the business is growing; it just means it’s Christmas.
To get a true sense of trajectory, businesses use Year-over-Year (YoY) calculations. This involves comparing a metric (like revenue) from one period to the same period in the previous year. If your revenue in Q1 of last year was $200,000 and your revenue in Q1 of this year is $250,000, you have achieved a 25% YoY increase. This is a much more reliable indicator of sustainable growth than short-term fluctuations.
Scalability and Cost-of-Goods-Sold (COGS) Dynamics
Percentage increase is also used to monitor efficiency. A healthy business aims to have its revenue percentage increase at a higher rate than its expense percentage increase.
If your revenue increases by 20%, but your cost of materials (COGS) increases by 30%, your profit margins are shrinking. This indicates a lack of scalability or a problem with your supply chain. By constantly calculating the percentage changes in both your “top line” (revenue) and “bottom line” (net profit), you can pinpoint exactly where the business needs optimization.
Essential Financial Tools for Automated Calculations
While knowing the manual formula is important for quick mental checks, modern financial management relies on tools to track these percentages at scale.
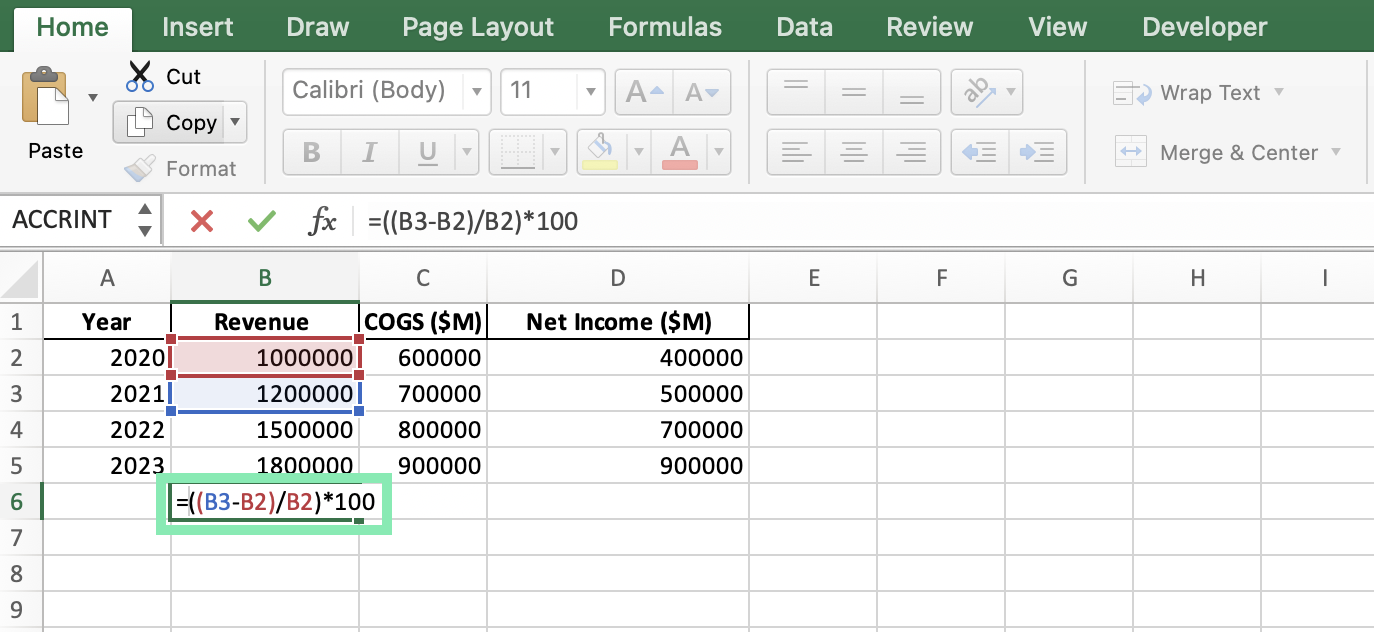
- Spreadsheet Software (Excel/Google Sheets): The formula
=(New-Old)/Oldis the most used function in financial modeling. You can set up “Conditional Formatting” to turn cells green when the percentage increase hits a certain target or red when it dips. - Portfolio Trackers: Tools like Personal Capital or Morningstar automatically calculate the percentage increase of your entire net worth and individual holdings daily, factoring in dividends and fees.
- Accounting Software: For business owners, platforms like QuickBooks or Xero provide “Trend Reports” that automatically display the percentage increase in various expense categories, helping you spot anomalies before they become crises.
Understanding how to figure out the percentage increase between two numbers is more than just a math lesson; it is a vital component of financial literacy. It allows you to look past the “noise” of raw numbers and see the “signal” of actual growth. Whether you are managing a household budget, a stock portfolio, or a multi-million dollar corporation, this simple calculation remains the most effective way to measure success and plan for the future.