In the world of finance, numbers are the language of progress. Whether you are tracking the performance of a high-growth stock, evaluating the health of a small business, or simply trying to outpace inflation with your personal savings, one metric stands above almost all others in terms of utility: percentage change.
Understanding how to compute and interpret percentage change is not merely a mathematical exercise; it is a fundamental pillar of financial literacy. It allows an investor to strip away the “noise” of raw dollar amounts and see the true relative growth or decline of an asset. This guide explores the mechanics of computing percentage change through the lens of money, investing, and business finance, providing you with the tools to make more informed economic decisions.
The Fundamentals of Financial Growth: Understanding the Formula
To navigate the complexities of the market, one must first master the basic arithmetic of change. In financial terms, percentage change represents the relative difference between a prior value and a current value. It tells us by what fraction an investment has grown or shrunk, normalized to a scale of 100.
The Basic Mathematical Equation
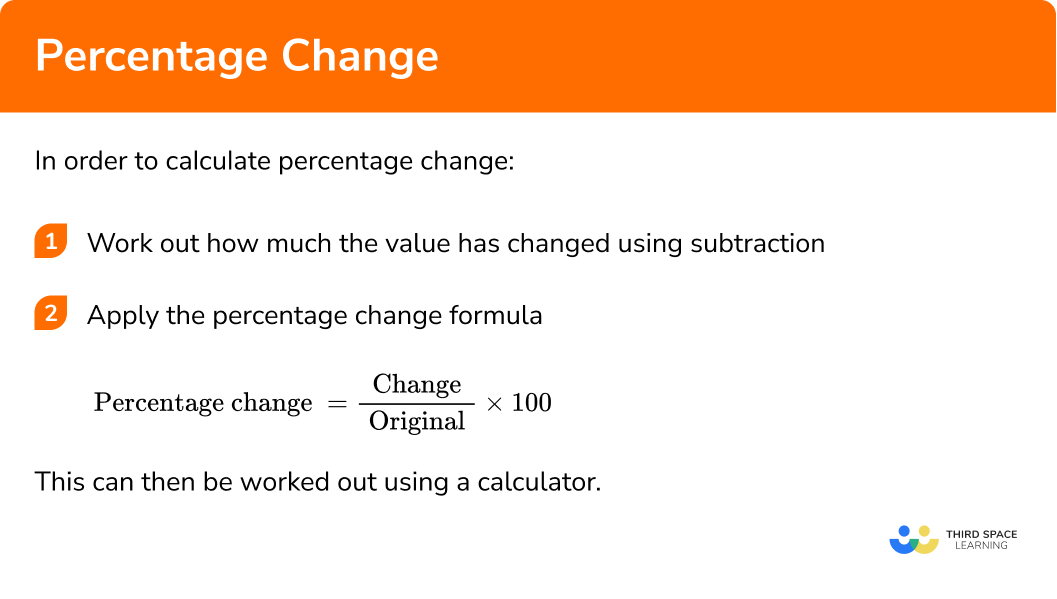
The formula for computing percentage change is straightforward, yet its implications are profound. To find the percentage change, you follow these steps:
- Subtract the original value (Old) from the new value (New).
- Divide that result by the original value.
- Multiply by 100 to convert the decimal into a percentage.
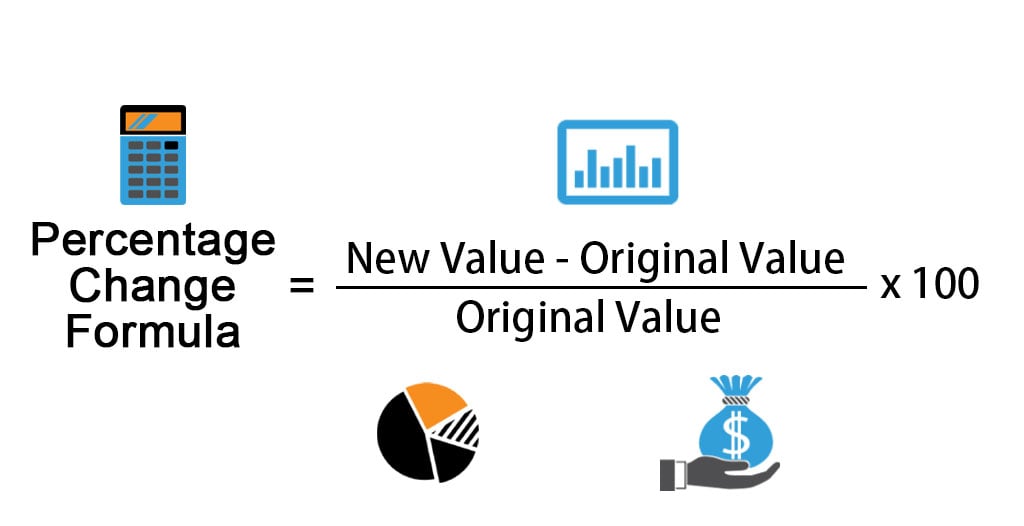
Mathematically, it is expressed as:
((New Value – Old Value) / Old Value) x 100 = Percentage Change
For example, if you purchased a share of a technology company for $150 and it is now trading at $180, the calculation would be:
($180 – $150) / $150 = 0.20
0.20 x 100 = 20% growth.
Interpreting Positive vs. Negative Change
In finance, the direction of the change is as critical as the magnitude. A positive percentage change indicates growth, appreciation, or profit. Conversely, a negative percentage change indicates a loss, depreciation, or a “drawdown.”
When performing these calculations, the denominator must always be the original value. This is a common point of confusion for novice investors. If a stock drops from $100 to $80, it is a 20% loss. However, if it then moves from $80 back up to $100, that is a 25% gain ($20 / $80). This asymmetry is a vital concept in wealth management, often referred to as the “mathematics of recovery,” highlighting why protecting capital is often more important than chasing high returns.
Applying Percentage Change to Investment Portfolios
For the modern investor, percentage change is the primary yardstick for performance. Raw gains can be deceptive. A $1,000 profit might sound substantial, but if it required a $1,000,000 investment, it represents a mere 0.1% return—a figure that likely underperforms even the most basic savings account.
Tracking ROI and Asset Performance
Return on Investment (ROI) is essentially a percentage change calculation applied to capital. By computing the percentage change of your entire portfolio over a specific period—quarterly, annually, or year-to-date—you can determine the efficacy of your investment strategy.
This calculation becomes more nuanced when accounting for “Total Return.” In the stock market, many companies pay dividends. To calculate your true financial percentage change, you must add any dividends received to the “New Value” before subtracting the “Old Value.” This provides a comprehensive view of how much money the asset actually generated for you, rather than just how much the price moved on an exchange.
The Importance of Benchmarking Against the Market
Computing your own percentage change is only the first step; the second is comparison. Professional money managers use percentage change to compare their performance against benchmarks like the S&P 500 or the Nasdaq Composite.
If your portfolio grew by 8% last year, you might feel successful. However, if the broader market grew by 15% in the same period, your relative performance was actually negative compared to a simple index fund. By using percentage change as a comparative tool, you can evaluate whether your active management (picking individual stocks or timing the market) is actually adding value or if you would be better off with a passive investment strategy.
Business Finance: Measuring Profitability and Growth

In the corporate world, percentage change is the heartbeat of the balance sheet. Executives, stakeholders, and analysts use these figures to determine if a company is scaling efficiently or if it is heading toward financial distress.
Year-Over-Year (YoY) Revenue Analysis
One of the most scrutinized metrics in business finance is Year-Over-Year (YoY) growth. This involves computing the percentage change in revenue or net income from one year to the next.
YoY analysis is superior to month-over-month analysis because it accounts for seasonality. For instance, a retail business might see a 50% increase in sales in December compared to November. While that looks impressive, it is expected due to the holiday season. A more accurate measure of health would be computing the percentage change between December of the current year and December of the previous year. If that change is positive, the business is experiencing genuine organic growth.
Margin Fluctuations and Cost Management
Percentage change is also applied to expenses and margins. If a company’s revenue grows by 10% but its operating expenses grow by 15%, the business is becoming less efficient. This “margin compression” is a red flag for investors.
By calculating the percentage change in “Cost of Goods Sold” (COGS), a business owner can identify if suppliers are raising prices faster than the business can raise its own prices. Monitoring these percentage shifts allows for proactive adjustments in pricing strategy or supply chain management before the bottom line is severely impacted.
Real-World Personal Finance: Inflation and Purchasing Power
Away from the stock market and corporate boardrooms, percentage change affects the daily lives of every consumer through the mechanism of inflation. Understanding how to calculate the “real” change in your money’s value is essential for long-term financial security.
How Inflation Impacts Your Savings
Inflation is measured by the percentage change in the Consumer Price Index (CPI), which tracks the average price of a basket of goods and services. If the annual inflation rate is 5%, the purchasing power of your cash has decreased by that same percentage.
To compute your “Real Rate of Return,” you must subtract the inflation percentage from your investment’s percentage gain. If your savings account offers a 4% interest rate but inflation is running at 6%, your real percentage change is -2%. Despite having more nominal dollars in your account, you can actually buy fewer goods than you could a year ago. Mastering this calculation helps individuals realize that “safe” cash can sometimes be a guaranteed way to lose wealth over time.
Budgeting Adjustments in a Changing Economy
On a household level, computing percentage change helps in auditing expenses. If your utility bill was $120 last year and is $150 this year, that is a 25% increase. By calculating these changes across various categories—housing, food, transport, and leisure—you can identify which areas of your lifestyle are experiencing the highest “personal inflation.” This data-driven approach to budgeting allows you to make logical cuts or reallocate funds to maintain your standard of living without falling into debt.
Common Pitfalls and Advanced Financial Nuances
While the formula is simple, the application of percentage change in finance often involves complexities that can lead to costly errors if misunderstood.
The Dangers of the “Percent of a Percent” Mistake
A frequent error in financial reporting is the confusion between “percentage points” and “percentage change.” If an interest rate rises from 3% to 4%, it has increased by one percentage point. However, the percentage change is actually 33.3% (($4 – $3) / $3).
In the context of loan interest or bond yields, this distinction is massive. For a borrower, a “1% increase” in the interest rate of a mortgage might actually result in a 10% or 15% increase in their monthly payment. Always clarify whether a figure refers to the absolute change in a rate or the relative change of the value itself.
Compounding and Long-Term Projections
Finally, it is important to remember that financial percentage changes are often compounded. When looking at long-term wealth building, we look at the Compound Annual Growth Rate (CAGR). Unlike a simple average of yearly percentage changes, CAGR provides the smoothed annual rate of return that would be required for an investment to grow from its beginning balance to its ending balance, assuming the profits were reinvested.
This is the “magic” of compound interest. A 10% gain this year followed by a 10% gain next year results in a total two-year percentage change of 21%, not 20%. By understanding how these percentages stack upon one another, you can better appreciate the value of time in the market and the power of consistent, long-term financial planning.
In conclusion, computing percentage change is far more than a math problem; it is a lens through which we view economic reality. By consistently applying this calculation to your investments, your business operations, and your personal budget, you move away from emotional decision-making and toward a disciplined, analytical approach to building and maintaining wealth.
aViewFromTheCave is a participant in the Amazon Services LLC Associates Program, an affiliate advertising program designed to provide a means for sites to earn advertising fees by advertising and linking to Amazon.com. Amazon, the Amazon logo, AmazonSupply, and the AmazonSupply logo are trademarks of Amazon.com, Inc. or its affiliates. As an Amazon Associate we earn affiliate commissions from qualifying purchases.