Inflation is a term frequently bandied about in economic discussions, news reports, and even everyday conversations. It describes the rate at which the general level of prices for goods and services is rising, and subsequently, the purchasing power of currency is falling. While the concept might seem abstract, understanding how inflation is calculated is fundamental for individuals, businesses, and governments alike. It impacts everything from the cost of your groceries and your savings account’s real value to corporate investment decisions and national monetary policy. Far from being a mere academic exercise, the methods used to measure inflation provide crucial insights into the health of an economy and guide financial strategies. This article will delve into the various mechanisms and indices employed to calculate inflation, offering a professional, insightful, and engaging exploration of this vital economic metric, strictly within the realm of personal finance, investing, and business finance.
The Fundamentals of Measuring Price Changes
At its core, calculating inflation involves tracking changes in the prices of a representative basket of goods and services over time. No single, perfect measure exists, as different indices capture different aspects of price changes for various purposes. However, three primary indices stand out as the most significant tools for gauging inflation: the Consumer Price Index (CPI), the Producer Price Index (PPI), and the Personal Consumption Expenditures (PCE) Price Index. Each offers a unique lens through which to view price dynamics, serving distinct analytical needs for financial stakeholders.
Understanding the Consumer Price Index (CPI)
The Consumer Price Index (CPI) is arguably the most recognized and widely cited measure of inflation, particularly for its direct relevance to households. It is designed to measure the average change over time in the prices paid by urban consumers for a market basket of consumer goods and services. In the United States, the Bureau of Labor Statistics (BLS) compiles the CPI by collecting price data from thousands of retail stores, service establishments, and rental units across the country.
The “market basket” is a carefully selected collection of items that represents what average households buy. This basket includes a broad range of categories such as food and beverages, housing (rent, homeowners’ equivalent rent), apparel, transportation (fuel, vehicle purchases, public transport), medical care, recreation, education, and communication. The composition of this basket is updated periodically to reflect changes in consumer spending patterns, ensuring its relevance. The CPI directly influences wage negotiations, social security adjustments, and provides a benchmark for cost-of-living adjustments, making its calculation a cornerstone of personal financial planning.
The Producer Price Index (PPI): A Forward Indicator
While the CPI looks at prices from the consumer’s perspective, the Producer Price Index (PPI) offers an alternative, and often forward-looking, view by measuring the average change over time in the selling prices received by domestic producers for their output. In essence, the PPI tracks prices at various stages of production, from raw materials to intermediate goods to finished products.
The PPI is important because changes in producer prices can often signal future changes in consumer prices. If producers face higher costs for raw materials or labor, they are likely to pass those costs on to consumers in the form of higher retail prices down the line. Thus, financial analysts and investors often monitor the PPI closely as an early indicator of inflationary pressures that might eventually affect the CPI. While less directly impactful on personal budgets than the CPI, understanding the PPI is crucial for businesses in forecasting costs and setting prices, and for investors in anticipating market shifts.
The Personal Consumption Expenditures (PCE) Price Index: The Fed’s Preferred Gauge
The third major inflation measure is the Personal Consumption Expenditures (PCE) Price Index, compiled by the Bureau of Economic Analysis (BEA). While similar in scope to the CPI, the PCE index is considered by many economists, including the Federal Reserve, to be a more comprehensive and accurate measure of consumer inflation. The Federal Reserve, for instance, explicitly targets a 2% annual inflation rate using the PCE index to guide its monetary policy decisions.
The PCE index differs from the CPI in several key ways. Firstly, it has a broader coverage of goods and services, including expenses paid by third parties on behalf of consumers (like employer-provided health insurance). Secondly, and crucially, the PCE allows for the “substitution effect.” This means that if the price of one good rises significantly, consumers might substitute it with a cheaper alternative (e.g., buying chicken instead of beef). The PCE index accounts for these shifts in consumer behavior, while the CPI’s fixed basket is slower to adapt. This dynamic weighting makes the PCE a more flexible and often smoother indicator of underlying inflation trends, providing a vital tool for macroeconomic analysis and policy formulation, which indirectly impacts all financial decisions.
The Mechanics of Inflation Calculation
Understanding the different indices is one thing, but grasping the actual arithmetic behind their calculation provides a deeper insight into how inflation figures are derived. While the specifics can be complex, the core principle relies on comparing current price levels to past price levels using index numbers.
The Basic Formula
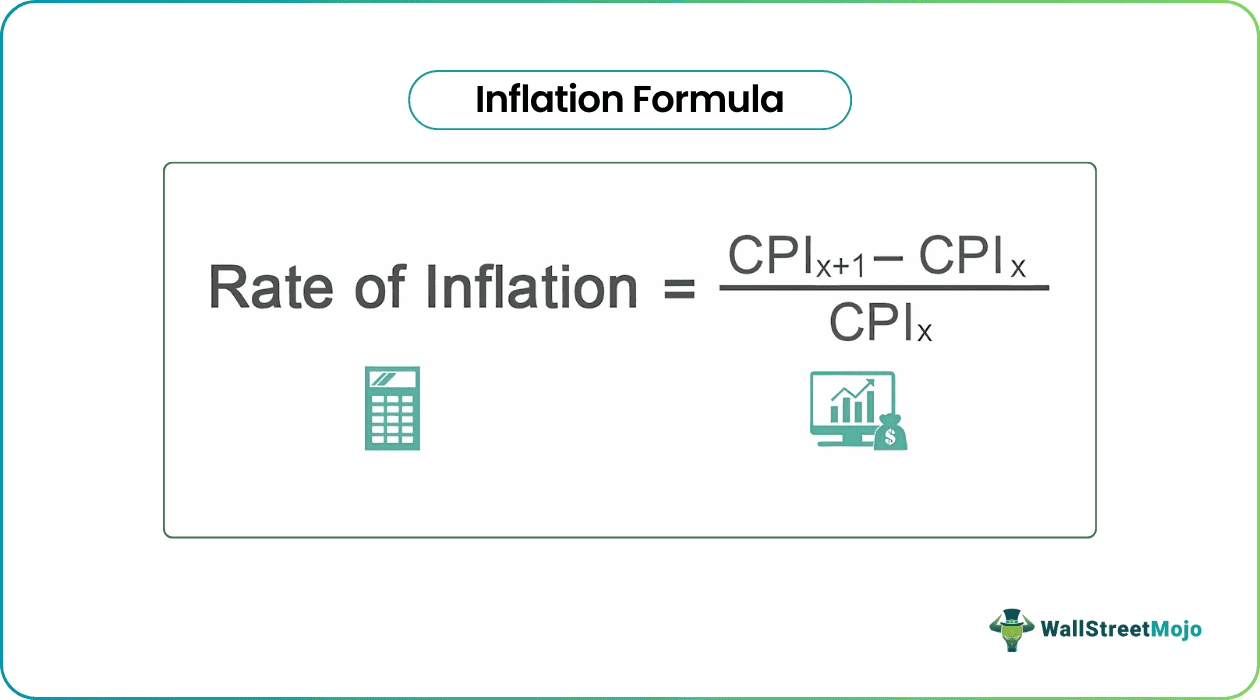
The fundamental formula for calculating the inflation rate between two periods is relatively straightforward once the index numbers are established. For any given price index (CPI, PPI, or PCE), the inflation rate is calculated as:
Inflation Rate = ((Current Period Index – Previous Period Index) / Previous Period Index) * 100
For example, if the CPI for January 2023 was 300 and the CPI for January 2022 was 290, the annual inflation rate would be:
((300 – 290) / 290) * 100 = (10 / 290) * 100 ≈ 3.45%
This means that over the past year, prices for the average consumer’s basket of goods and services increased by approximately 3.45%. This simple formula is the bedrock upon which all reported inflation rates are built, allowing for month-over-month, year-over-year, or any period-over-period comparisons.
Base Periods and Index Numbers
The use of “index numbers” is crucial in inflation calculation. Instead of tracking the absolute monetary value of the market basket, statistical agencies assign a base period (or base year) an arbitrary index value, typically 100. All subsequent (or prior) periods’ prices are then expressed as a percentage relative to this base period.
For instance, if the CPI for the base year 1982-84 was set to 100, and the CPI for a later year like 2023 is 300, it means that prices have, on average, tripled since the 1982-84 period. This method allows for easy comparison of price levels across vastly different timeframes and simplifies the calculation of percentage changes, making complex price data more digestible for financial analysis and public understanding.
Addressing Weighting and Substitution Bias

One of the significant challenges in accurately calculating inflation is accounting for the relative importance of different goods and services in a typical budget, known as “weighting.” An increase in the price of housing, for example, has a far greater impact on household budgets than an increase in the price of apples. Therefore, statistical agencies assign weights to each category in the market basket based on its share of total consumer spending. These weights are meticulously updated over time to reflect evolving spending patterns.
Furthermore, statistical agencies employ sophisticated methods to address “substitution bias” and “quality adjustments.” Substitution bias occurs when consumers shift away from goods that have become more expensive towards cheaper alternatives. The PCE index, as noted, inherently accounts for this. The CPI also attempts to mitigate this through periodic updates to its basket and chained CPI calculations. Quality adjustments are made to ensure that a price increase isn’t simply due to an improvement in the quality of a product (e.g., a car with more safety features or a smartphone with better technology) rather than a pure price increase for the same utility. These adjustments are vital for ensuring that inflation figures genuinely reflect changes in purchasing power, not just changes in product offerings.
Beyond the Headline Number: Nuances and Other Measures
While the main indices provide a broad overview, a deeper dive reveals various nuances and alternative measures that offer more specific insights, which are invaluable for comprehensive financial analysis and personal budgeting.
Core vs. Headline Inflation
When discussing inflation, you will often hear about “headline inflation” versus “core inflation.” Headline inflation refers to the inflation rate for all items in the chosen basket (CPI or PCE). Core inflation, on the other hand, excludes the volatile food and energy components.
Food and energy prices are notoriously susceptible to short-term fluctuations due to factors like weather patterns, geopolitical events, and supply shocks. While these affect household budgets directly, their volatility can obscure underlying, longer-term inflationary trends. Central banks, like the Federal Reserve, often focus on core inflation when making monetary policy decisions because it is considered a better indicator of persistent inflationary pressures and less prone to temporary shocks. For personal finance, understanding both is crucial: headline inflation shows your immediate cost of living, while core inflation hints at where prices are headed more sustainably.
Sector-Specific Inflation
The overall inflation rate is an average, and individual categories can experience vastly different price movements. For instance, while overall inflation might be moderate, housing costs, healthcare expenses, or education tuition could be soaring. This “sector-specific inflation” is extremely important for individuals to track, as it often has a disproportionate impact on their personal budgets depending on their stage of life and spending priorities.
Young families might be more affected by housing and childcare costs, while retirees might be more sensitive to healthcare inflation. Businesses in specific sectors must also pay close attention to the inflation rates within their supply chains and product markets to accurately forecast costs and revenues. Analyzing these granular inflation data points allows for more precise budgeting, investment diversification, and strategic business planning.
The GDP Deflator: A Broader Economic View
Finally, another significant measure is the Gross Domestic Product (GDP) Deflator. Unlike the CPI and PCE, which focus primarily on consumer spending, the GDP deflator measures the average change in prices for all new, domestically produced, final goods and services in an economy. This includes not just consumer goods, but also business investment (e.g., machinery, buildings), government spending, and net exports.
The GDP deflator is considered the broadest measure of inflation as it reflects the prices of everything produced within a country’s borders. It’s often used by economists and policymakers to assess the overall price level of the economy and to convert nominal GDP (current dollar value) into real GDP (constant dollar value), allowing for accurate comparisons of economic output over time, independent of price changes. While less direct for personal financial decisions, the GDP deflator provides a comprehensive macroeconomic picture that informs policies impacting the entire financial landscape.
The Impact of Inflation on Personal Finance and Investing
Understanding how inflation is calculated is not merely an intellectual exercise; it has profound and tangible implications for individual financial well-being and investment strategies. Inflation is a silent tax, steadily eroding purchasing power and necessitating proactive financial planning.
Erosion of Purchasing Power
The most immediate and fundamental impact of inflation is the erosion of purchasing power. As prices rise, each unit of currency buys fewer goods and services. A dollar today is worth less than a dollar yesterday if prices have increased. This directly affects savings: money held in low-interest savings accounts, or even cash under the mattress, loses value over time.
For individuals, this means that their fixed income, pensions, or stagnant wages will be able to afford less over the years. Real returns on investments—returns after accounting for inflation—become the true measure of financial growth. If an investment yields 5% but inflation is 3%, the real return is only 2%. Recognizing this erosion is critical for ensuring long-term financial security.
Inflation and Investment Strategies
Inflation significantly influences investment strategies. Certain assets tend to perform better during inflationary periods, acting as a hedge, while others suffer. For instance, real assets like real estate, commodities (e.g., gold, oil), and Treasury Inflation-Protected Securities (TIPS) are often considered inflation hedges because their values tend to rise with general price levels.
Conversely, fixed-income investments like bonds can be particularly vulnerable to inflation. If a bond pays a fixed 3% interest, but inflation climbs to 4%, the real return is negative, and the bond’s purchasing power diminishes. Equity markets can be mixed; some companies with strong pricing power can pass on increased costs, while others may see their margins squeezed. Savvy investors analyze inflation trends to adjust their portfolios, aiming to preserve and grow their real wealth.

Budgeting and Financial Planning in an Inflating Economy
For personal finance, inflation demands a dynamic approach to budgeting and financial planning. Static budgets quickly become outdated as costs for essentials like food, housing, and transportation increase. Individuals must regularly review and adjust their budgets, ensuring their income keeps pace with rising expenses.
This also extends to retirement planning. Future retirement needs must be estimated not in today’s dollars, but in inflated future dollars, requiring higher savings rates and investment growth to maintain desired living standards. Wage growth is paramount; if wages don’t increase at least as much as the inflation rate, individuals effectively become poorer. By monitoring inflation calculations and understanding their implications, households can make informed decisions about their spending, saving, investing, and career choices to navigate an ever-changing economic landscape.
In conclusion, “how do you calculate inflation” is a question that unlocks a deeper understanding of economic dynamics and their profound impact on our financial lives. From the widely cited CPI to the Fed’s preferred PCE, and the forward-looking PPI, these indices offer a multi-faceted view of price changes. The mechanics of their calculation, involving base periods, index numbers, and careful weighting, highlight the statistical rigor involved. Beyond the headline figures, the distinction between core and headline inflation, and the examination of sector-specific price movements, provide critical insights for targeted financial analysis. Ultimately, for anyone involved in personal finance, investing, or business finance, a grasp of inflation calculation is not just academic; it is an essential tool for making intelligent decisions, protecting purchasing power, and building resilient financial futures in an economy constantly shaped by the ebb and flow of prices.
aViewFromTheCave is a participant in the Amazon Services LLC Associates Program, an affiliate advertising program designed to provide a means for sites to earn advertising fees by advertising and linking to Amazon.com. Amazon, the Amazon logo, AmazonSupply, and the AmazonSupply logo are trademarks of Amazon.com, Inc. or its affiliates. As an Amazon Associate we earn affiliate commissions from qualifying purchases.