In the world of finance, few metrics carry as much weight as the Consumer Price Index (CPI). Whether you are an individual investor trying to protect your portfolio, a business owner setting prices, or a household manager balancing a monthly budget, understanding how CPI is calculated—and what it represents—is fundamental to your financial health. Often referred to as the “economic thermometer,” the CPI measures the average change over time in the prices paid by urban consumers for a market basket of consumer goods and services.
While the headline numbers are reported monthly by government agencies like the Bureau of Labor Statistics (BLS) in the United States, the mechanics behind the calculation remain a mystery to many. By deconstructing the formula and the methodology, we can better understand how inflation erodes purchasing power and how we can strategically position our money to combat it.
Understanding the Fundamentals: What is the Consumer Price Index?
Before diving into the mathematics, it is essential to understand what the CPI represents. At its core, the CPI is a measure of inflation or deflation. It tracks the price changes of thousands of items that an average household consumes. However, it doesn’t just look at any random set of goods; it uses a specific methodology to ensure the data is representative of actual spending habits.
The Market Basket: What’s Inside?
The foundation of the CPI is the “market basket.” This is a representative sample of approximately 80,000 goods and services that the average urban consumer buys. These items are categorized into eight major groups:
- Housing: Rent, owners’ equivalent rent, fuel oil, and bedroom furniture.
- Food and Beverages: Breakfast cereal, milk, coffee, chicken, and even dining out.
- Transportation: New vehicles, airline fares, gasoline, and motor vehicle insurance.
- Medical Care: Prescription drugs, medical supplies, and hospital services.
- Apparel: Men’s shirts, women’s dresses, jewelry.
- Recreation: Televisions, pets and pet products, sports equipment, and admissions.
- Education and Communication: College tuition, postage, telephone services, and computer software.
- Other Goods and Services: Tobacco, haircuts, and funeral expenses.
By tracking this diverse basket, economists can see where prices are rising most sharply and where they might be cooling off.
The Base Year Concept
To measure change, you need a starting point. This is known as the “base year.” In the United States, the current base period is often cited as the average of prices from 1982 to 1984. The index value for the base period is always set at 100. If the current CPI is 300, it means that the cost of the market basket has tripled since the base period. This benchmarking allows for a standardized comparison across decades, helping investors see the long-term trend of currency devaluation.
The Step-by-Step Formula for Calculating CPI
Calculating the CPI involves a relatively straightforward algebraic formula, but the data collection that precedes it is immense. The formula measures the ratio of the cost of the market basket in the current year to the cost of the same basket in the base year.
Identifying the Market Basket Costs
The first step is to determine the total price of the basket in two different time periods.
- Base Year Cost: The sum of (Price of Good A in Base Year × Quantity of Good A) + (Price of Good B in Base Year × Quantity of Good B), and so on.
- Current Year Cost: The sum of (Price of Good A in Current Year × Quantity of Good A) + (Price of Good B in Current Year × Quantity of Good B).
Note that the quantities remain fixed between the two calculations. This is intentional; the goal is to isolate the change in price, not to account for changes in consumer behavior or the volume of goods purchased.
Applying the CPI Formula
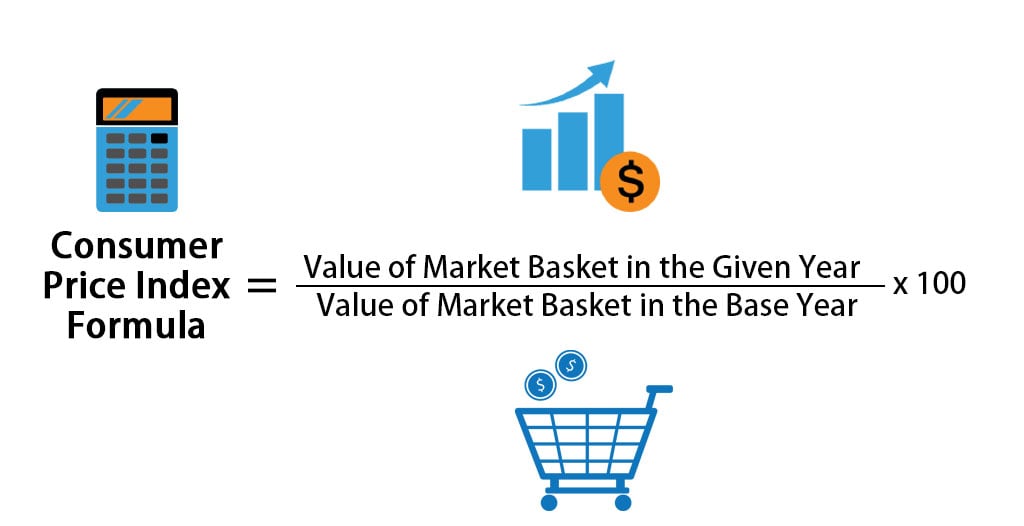
Once the costs are identified, the formula is applied:
CPI = (Cost of Market Basket in Current Year / Cost of Market Basket in Base Year) × 100
For example, if the market basket cost $500 in the base year and the same basket costs $1,200 today, the calculation would be:
(1,200 / 500) = 2.4
2.4 × 100 = 240
The CPI is 240. This tells us there has been a 140% increase in the price level since the base period.
Calculating the Inflation Rate from CPI
While the CPI itself is an index number, most people are more interested in the inflation rate—the percentage change in the index over a specific period (usually a year). To find the annual inflation rate, you compare the CPI of the current month to the CPI of the same month in the previous year:

Inflation Rate = [(CPI in Year 2 – CPI in Year 1) / CPI in Year 1] × 100
If the CPI was 240 last year and is 252 this year:
(252 – 240) / 240 = 0.05
0.05 × 100 = 5%
This 5% figure is what you will hear on the news, and it is the figure that directly impacts your personal finance decisions.
Why CPI Matters for Your Personal Finances and Investments
Understanding how to calculate CPI is academic unless you apply it to your financial strategy. In a “Money” context, CPI is the primary gauge for determining the “real” value of your assets and income.
Impact on Purchasing Power
Purchasing power is the amount of goods or services that one unit of currency can buy. When CPI rises, your purchasing power falls. If your salary stays the same while CPI increases by 5%, you have effectively taken a 5% pay cut in terms of what you can actually afford. For individuals, this means that tracking CPI is essential for negotiating raises. If your annual increase is 3% but inflation is 6%, you are falling behind.
Adjusting Your Investment Strategy
Investors use CPI to calculate “Real Returns.” The nominal return is the percentage gain you see on your brokerage statement, but the real return is the nominal return minus inflation.
- Nominal Return: 8%
- Inflation (CPI): 4%
- Real Return: 4%
If CPI is high, traditional “safe” investments like savings accounts or Certificates of Deposit (CDs) may actually result in a loss of wealth if their interest rates are lower than the inflation rate. This often pushes investors toward “inflation hedges” such as real estate, commodities, or Treasury Inflation-Protected Securities (TIPS), which are specifically designed to increase in value alongside the CPI.
CPI and Interest Rates
Central banks, such as the Federal Reserve, use CPI as a primary signal for monetary policy. If CPI is rising too fast, the Fed may raise interest rates to cool the economy. For the average person, this means that a high CPI reading today often leads to higher mortgage rates, higher credit card APRs, and higher car loan costs tomorrow. Conversely, high CPI can also mean higher yields on high-yield savings accounts, creating a double-edged sword for your personal balance sheet.
Limitations of CPI: What the Numbers Don’t Always Tell You
While the CPI is a powerful tool, it is not a perfect reflection of every individual’s financial reality. There are several built-in biases and exclusions that you should be aware of when using these figures for your own financial planning.
Substitution Bias
The standard CPI calculation assumes the market basket remains fixed. However, in the real world, consumers are smart. If the price of beef skyrockets, people buy more chicken. This is called “substitution.” Because the basic CPI formula doesn’t always account for these shifts immediately, it can sometimes overstate the actual cost of living increase experienced by a flexible consumer.
Introduction of New Goods and Quality Changes
The CPI can struggle to account for the value of technological advancement. A smartphone today costs more than a cell phone did in 2005, but it also does significantly more. If a laptop stays the same price but its processing speed doubles, the “price per unit of quality” has actually gone down. Economists use “hedonic adjustment” to try to account for this, but it remains a controversial and complex part of the calculation that can make the CPI feel disconnected from the prices you see at the store.
Personal Inflation vs. National CPI
The CPI represents an average urban consumer. If you live in a rural area, your costs may differ. If you are a retiree who has paid off your mortgage, you are less affected by rising “Owners’ Equivalent Rent,” which is a massive component of the CPI. Conversely, if you spend a large portion of your income on medical care or education—sectors that often outpace general inflation—your personal “CPI” might be much higher than the national average.

Practical Tools and Resources for Tracking CPI
For those looking to manage their money with precision, simply knowing the formula isn’t enough. You need to know where to find the data and how to use it.
- Bureau of Labor Statistics (BLS): The primary source for U.S. data. Their monthly “Consumer Price Index Summary” provides a deep dive into which sectors are driving inflation.
- Inflation Calculators: Many financial websites offer “Buying Power” calculators. These allow you to input a dollar amount from a specific year and see what it would be worth today based on CPI data. This is a sobering but necessary exercise for long-term retirement planning.
- The “Core” CPI: When looking at data, distinguish between “Headline CPI” and “Core CPI.” Core CPI excludes volatile food and energy prices. While you still have to pay for gas and groceries, investors often look at Core CPI to understand the long-term underlying trend of inflation without the “noise” of temporary supply shocks.
In conclusion, calculating the CPI is more than just an exercise in division and multiplication; it is a vital skill for anyone serious about wealth preservation. By understanding what goes into the basket, how the index is formulated, and how it impacts everything from your grocery bill to your bond portfolio, you can make more informed, proactive decisions with your money. In an era of economic volatility, being “inflation-literate” is no longer optional—it is a requirement for financial success.
aViewFromTheCave is a participant in the Amazon Services LLC Associates Program, an affiliate advertising program designed to provide a means for sites to earn advertising fees by advertising and linking to Amazon.com. Amazon, the Amazon logo, AmazonSupply, and the AmazonSupply logo are trademarks of Amazon.com, Inc. or its affiliates. As an Amazon Associate we earn affiliate commissions from qualifying purchases.