
The PEG (Price/Earnings to Growth) ratio is a widely used financial metric that helps investors determine if a stock’s price is justified given its earnings growth potential. Developed by legendary investor Peter Lynch, the PEG ratio refines the more common Price-to-Earnings (P/E) ratio by incorporating a company’s expected earnings per share (EPS) growth rate. While the P/E ratio gives a snapshot of how much investors are willing to pay for each dollar of a company’s earnings, the PEG ratio offers a more nuanced view, assessing whether that P/E is reasonable in light of the company’s future growth prospects. In essence, it helps answer the question: “Am I paying a fair price for this company’s growth?”

Understanding the PEG Ratio Formula
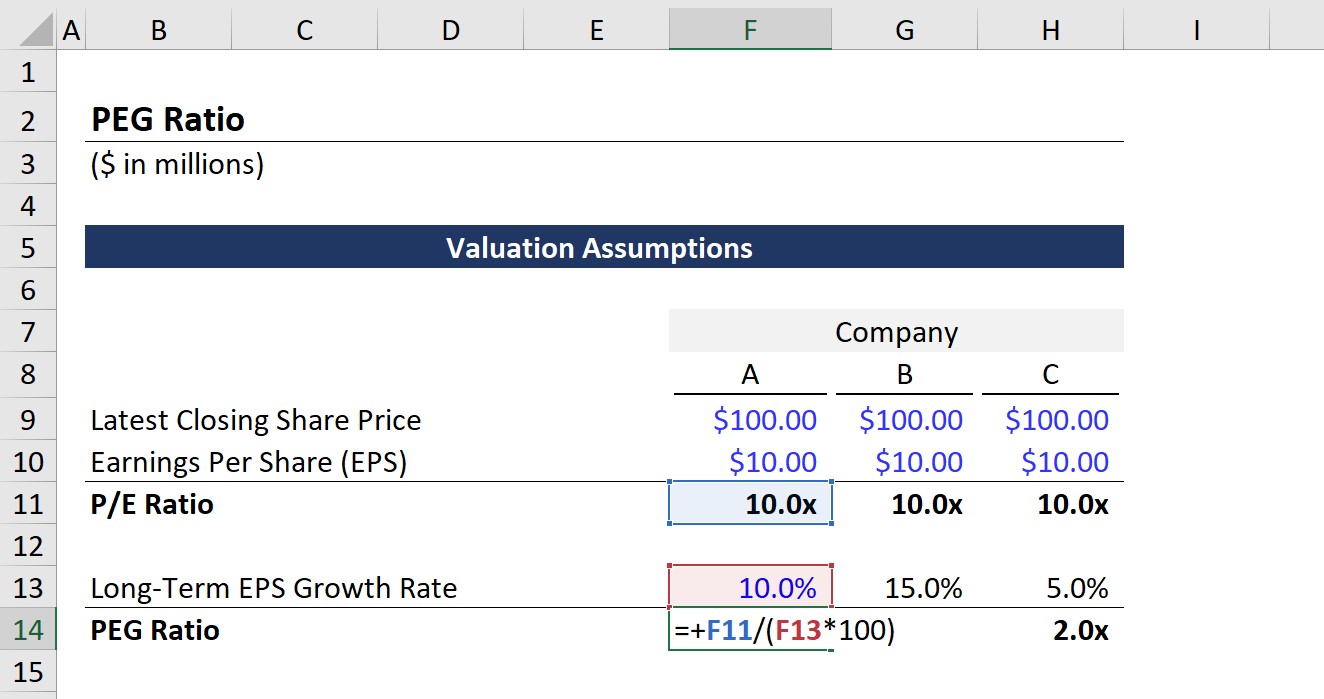
At its core, the PEG ratio is a simple division, but its components require a clear understanding. The formula is:
PEG Ratio = (P/E Ratio) / Annual EPS Growth Rate
Let’s break down each element:
The P/E Ratio
The Price-to-Earnings (P/E) ratio is a fundamental valuation multiple that measures a company’s current share price relative to its per-share earnings. It is calculated as:
P/E Ratio = Market Value Per Share / Earnings Per Share (EPS)
- Market Value Per Share: This is the current price at which a single share of the company’s stock trades on the open market.
- Earnings Per Share (EPS): This represents the portion of a company’s profit allocated to each outstanding share of common stock. It’s typically calculated over the last twelve months (trailing P/E) or based on future earnings estimates (forward P/E).
A high P/E ratio generally suggests that investors are expecting higher earnings growth in the future compared to companies with a lower P/E. However, a high P/E alone doesn’t tell you if that growth expectation is truly justified. This is where the PEG ratio comes into play.
The Annual EPS Growth Rate
This component is the estimated percentage rate at which a company’s earnings per share are expected to grow over a specified future period, usually the next 1 to 5 years.
- Projected Growth: Unlike the P/E ratio, which often uses historical or current earnings, the PEG ratio typically relies on future earnings growth estimates. These estimates are usually provided by financial analysts covering the company.
- Significance of Growth: A company that can consistently grow its earnings is generally more valuable than one with stagnant or declining earnings. The PEG ratio attempts to quantify this relationship by factoring growth directly into the valuation.
Example Calculation:
Imagine Company A has a P/E ratio of 30 and its annual EPS growth rate is projected to be 15%.
PEG Ratio = 30 / 15 = 2.0
Now consider Company B with a P/E ratio of 30, but its annual EPS growth rate is projected to be 30%.
PEG Ratio = 30 / 30 = 1.0
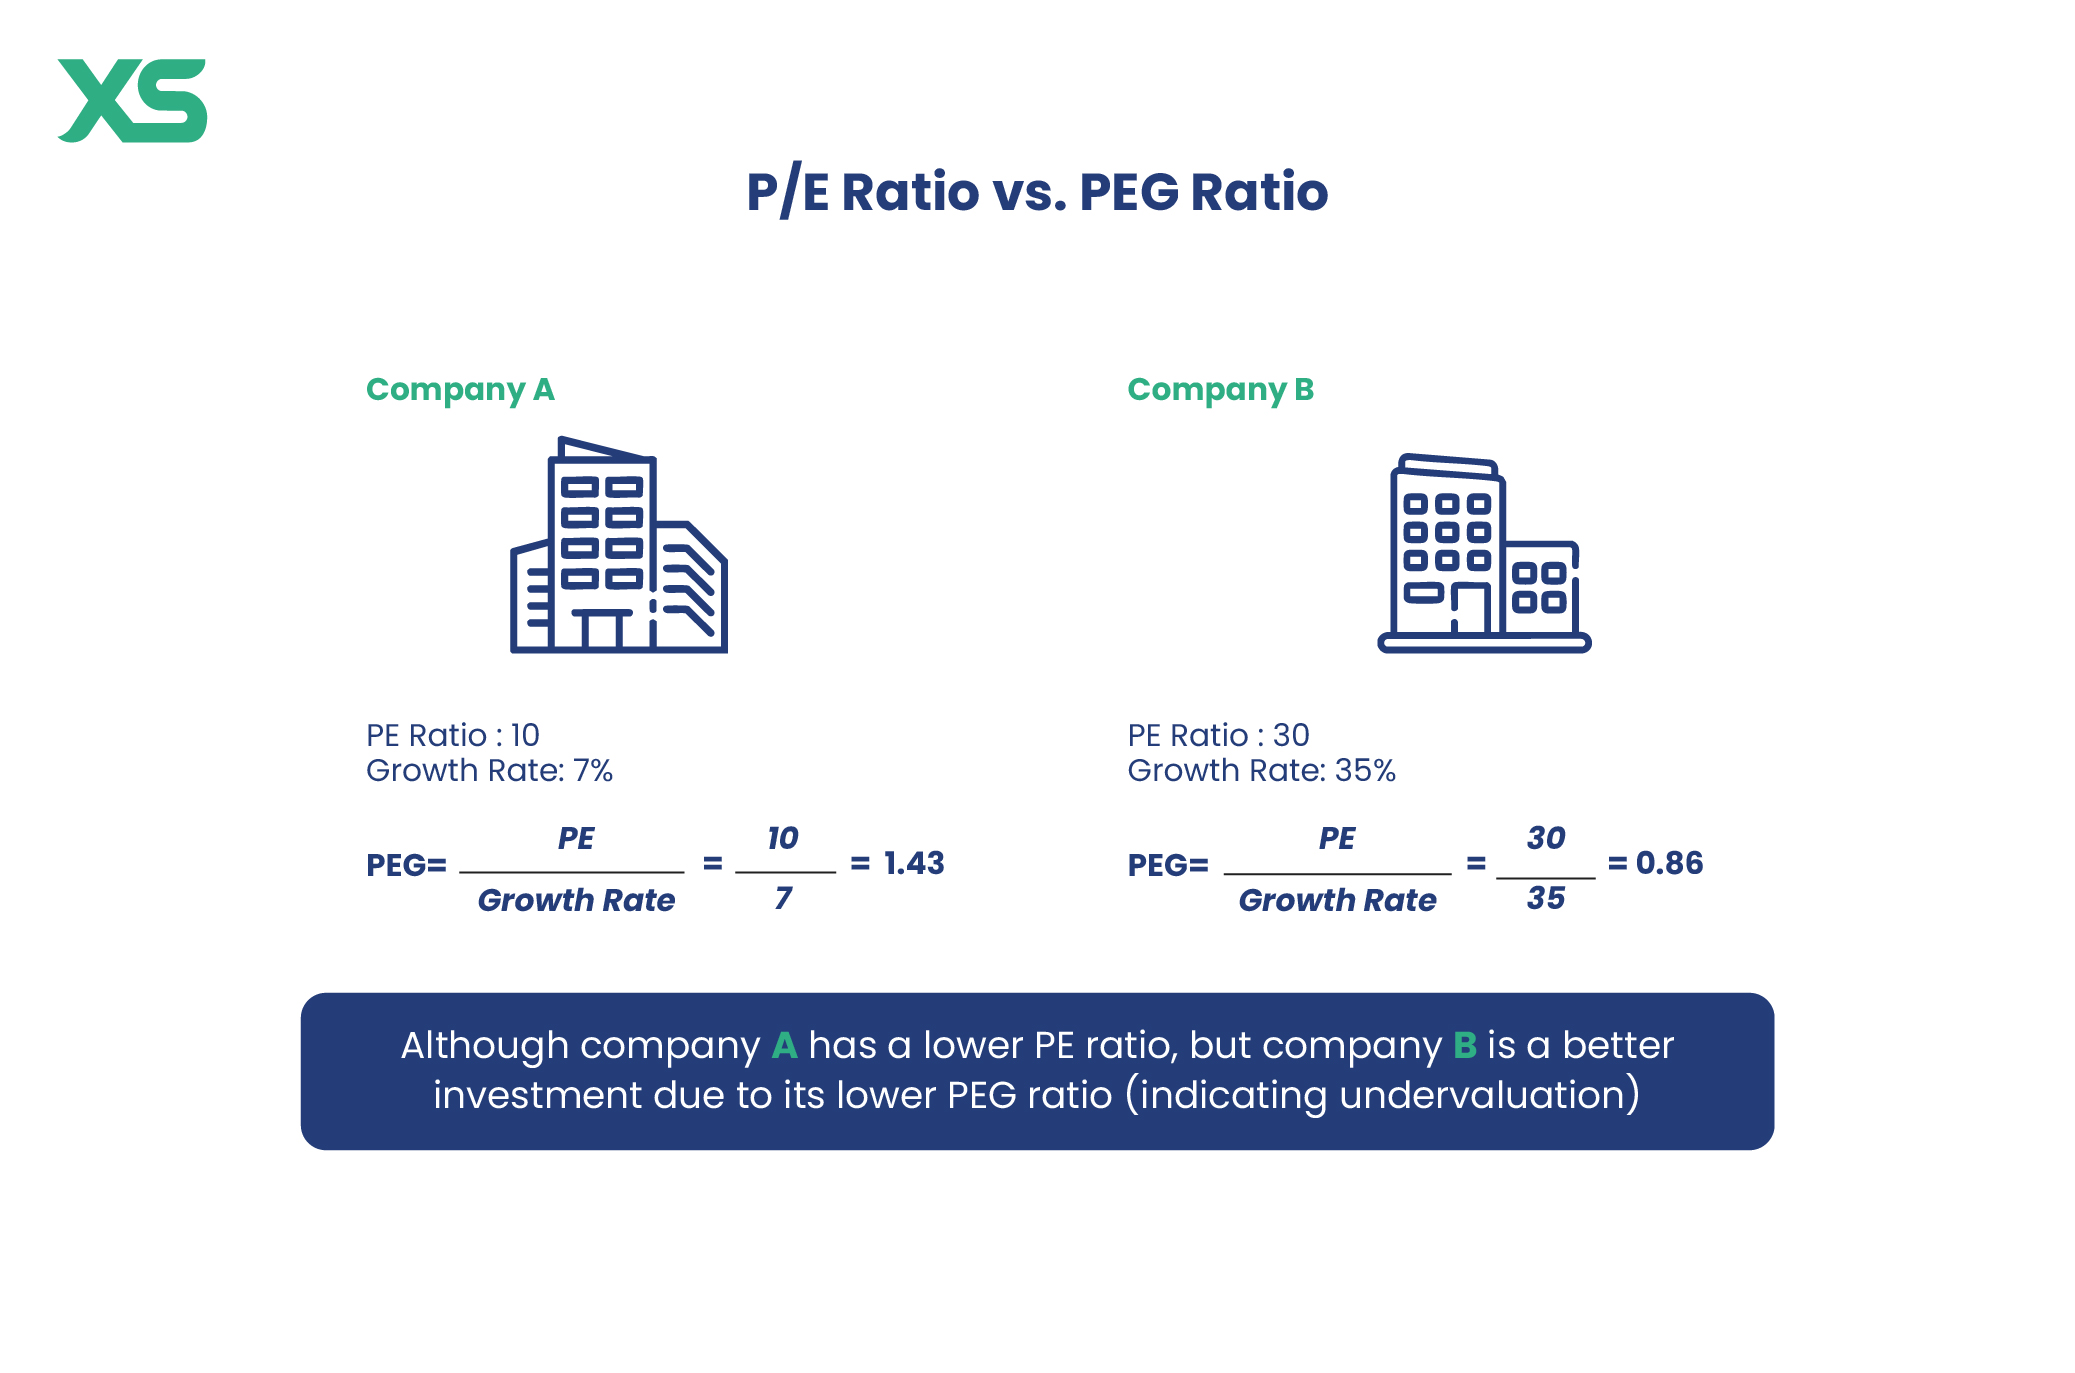
Even though both companies have the same P/E ratio, the PEG ratio suggests that Company B offers more growth for the price, making it potentially more attractive from a growth-adjusted valuation perspective.
Why Investors Use the PEG Ratio
The PEG ratio offers a critical advantage over the P/E ratio by incorporating a forward-looking perspective on growth. This makes it an indispensable tool for many investors, particularly those focused on growth stocks.
Beyond the P/E Ratio
The P/E ratio, while fundamental, has a significant limitation: it doesn’t account for a company’s earnings growth rate. A stock with a high P/E might appear overvalued, but if that company is growing its earnings rapidly, the high P/E could be perfectly justifiable. Conversely, a low P/E might seem attractive, but if the company’s earnings are stagnant or declining, it could be a value trap. The PEG ratio bridges this gap, allowing investors to normalize the P/E ratio by factoring in growth.
Valuing Growth Stocks
Growth investors often seek companies with strong future earnings potential. However, these companies frequently trade at high P/E ratios due to market anticipation of their success. The PEG ratio helps distinguish between truly overvalued growth stocks and those whose high P/E is a reasonable reflection of their robust growth trajectory. A high-growth company with a P/E of 50 might still be a better value than a slow-growth company with a P/E of 20, if its growth rate is significantly higher.
Comparing Companies
The PEG ratio allows for more meaningful comparisons between companies, especially across different industries or growth stages. A P/E of 25 might be considered high for a mature utility company but reasonable for a fast-growing tech startup. By dividing the P/E by the growth rate, the PEG ratio provides a standardized metric that adjusts for these inherent differences, helping investors identify which company offers better value relative to its growth.
Identifying Undervalued vs. Overvalued Stocks
The PEG ratio provides a clear numerical benchmark for assessing valuation relative to growth. This simple rule of thumb allows investors to quickly screen for potentially undervalued or overvalued opportunities. It serves as an initial filter, guiding further research into companies that appear to offer attractive growth at a reasonable price.
Interpreting PEG Ratio Values
The interpretation of the PEG ratio is fairly straightforward, with specific values generally signaling different valuation perspectives. However, it’s crucial to remember that these are guidelines, not absolute rules, and context is always paramount.
PEG < 1: Potentially Undervalued
A PEG ratio less than 1 (e.g., 0.5 or 0.8) is often considered a favorable sign. It suggests that the market may not be fully appreciating or pricing in the company’s expected earnings growth. In simple terms, you might be getting more growth for each unit of P/E. Peter Lynch famously considered a PEG ratio of 1 to be “fairly valued,” and anything below 1 to be a potential bargain. These stocks could be attractive for investors looking for growth at a reasonable price, as they might have significant upside if the market re-evaluates their growth prospects.
PEG = 1: Fairly Valued
A PEG ratio equal to 1 suggests that the stock is fairly valued, meaning its P/E ratio is in line with its expected earnings growth rate. The market is essentially paying one unit of price-to-earnings for one unit of earnings growth. For many growth investors, a PEG of 1 is considered a reasonable entry point, indicating that the stock isn’t excessively expensive relative to its future potential.
PEG > 1: Potentially Overvalued
A PEG ratio greater than 1 (e.g., 1.5 or 2.0) generally indicates that the stock might be overvalued relative to its anticipated earnings growth. This implies that investors are paying a higher premium for the company’s earnings growth than might be justified. A high PEG ratio could mean that the stock’s current price reflects overly optimistic growth expectations that may be difficult for the company to achieve. Investors should exercise caution with such stocks, as they carry a higher risk of disappointment if growth falters.
Context Matters
While these interpretations provide a useful framework, it’s vital to apply them within the appropriate context.
- Industry Norms: What constitutes a “good” PEG ratio can vary significantly across industries. For instance, high-growth technology companies might consistently trade at higher P/E ratios and thus higher PEG ratios than mature, slow-growth utility companies. Comparing a tech stock’s PEG to a utility stock’s PEG without considering their distinct industry dynamics would be misleading.
- Company Specifics: Factors such as a company’s market dominance, competitive advantages, new product pipeline, and financial health all influence whether a particular PEG ratio is truly justified.
Limitations and Considerations
While the PEG ratio is a powerful tool, it’s not without its limitations. Investors should be aware of these drawbacks to avoid making decisions based on an incomplete picture.
Reliance on Growth Projections
The most significant limitation of the PEG ratio is its dependence on future earnings growth rate estimates. These projections are inherently uncertain and can be highly subjective.
- Analyst Estimates: Growth rates are often derived from financial analysts’ forecasts. These forecasts can vary widely among different analysts and are subject to revision, sometimes significantly, as new information emerges. Relying on a single analyst’s estimate or an average that might include outliers can skew the PEG ratio.
- Forecasting Accuracy: Predicting future growth, especially over several years, is challenging for even the most experienced analysts. Economic downturns, competitive pressures, technological disruptions, or management missteps can drastically alter a company’s growth trajectory, rendering previous PEG calculations inaccurate.
Volatility of Earnings
The PEG ratio works best for companies with relatively stable and predictable earnings growth. It becomes less reliable for companies with highly volatile or cyclical earnings, where growth rates can swing dramatically from year to year. For example, a company in a highly cyclical industry might show an unusually high growth rate during an upswing, artificially lowering its PEG, only to see growth disappear or turn negative in a downturn.
Industry Specifics
As mentioned, what constitutes an “acceptable” or “attractive” PEG ratio can vary widely by industry. Comparing the PEG of a software company growing at 25% annually to an established consumer staples company growing at 5% annually without considering their respective industry growth rates and capital requirements would be misleading. Industries with higher average growth rates might command higher P/E multiples and thus, potentially higher PEG ratios.
Negative Earnings or Growth
The PEG ratio is rendered ineffective or meaningless for companies with:
- Negative Earnings: If a company is not profitable (negative EPS), its P/E ratio will be negative, making the PEG ratio calculation undefined or difficult to interpret in a standard way.
- Negative Growth Rate: If a company is expected to have negative EPS growth, the PEG ratio will also be negative. A negative PEG ratio doesn’t fit the standard interpretation framework of “undervalued” or “overvalued.” It simply highlights that the company is shrinking, and other valuation metrics would be more appropriate.
Debt and Other Financial Health Metrics
The PEG ratio focuses solely on price, earnings, and growth. It does not account for a company’s overall financial health, including:
- Debt Load: A company with a seemingly attractive PEG ratio might be heavily leveraged, posing significant financial risk that the PEG ratio does not capture.
- Cash Flow: Strong earnings growth is good, but sustainable growth often requires robust free cash flow, which the PEG ratio ignores.
- Balance Sheet Strength: Assets, liabilities, and shareholder equity are all crucial components of a company’s financial stability, none of which are directly considered by the PEG ratio.
- Management Quality: The quality of a company’s management team, its competitive landscape, and its overall business model are qualitative factors that are critical for long-term success but are outside the scope of the PEG ratio.
Short-Term vs. Long-Term Growth
The time horizon for the “annual EPS growth rate” is critical. Some sources might use 1-year forward growth, while others use 3-year or 5-year average growth. Longer-term projections are inherently more uncertain, but very short-term projections might not capture the true long-term potential of a company. Consistency in the growth rate’s time horizon is crucial when comparing companies.
Integrating PEG into Your Investment Strategy
The PEG ratio is a valuable tool, but it should be part of a comprehensive investment strategy, not the sole determinant of your decisions.
A Starting Point, Not a Sole Decider
Think of the PEG ratio as an excellent initial screening tool. It can help you quickly identify companies that appear to offer good growth at a reasonable price, narrowing down a vast universe of stocks to a manageable list for further investigation. However, never rely on the PEG ratio in isolation. A low PEG might flag a potential opportunity, but it doesn’t guarantee a good investment.
Complementary Metrics
To form a complete picture, the PEG ratio should be used in conjunction with other fundamental analysis tools:
- P/E Ratio: Understand the raw P/E ratio before adjusting for growth.
- P/B Ratio (Price-to-Book): Useful for valuing asset-heavy companies.
- Debt-to-Equity Ratio: Assess financial leverage and risk.
- Return on Equity (ROE) / Return on Invested Capital (ROIC): Gauge management’s efficiency in generating profits from shareholder equity or invested capital.
- Free Cash Flow (FCF): Evaluate a company’s ability to generate cash after accounting for capital expenditures.
- Dividend Yield: If income is a factor in your strategy.
Due Diligence is Key
After identifying potential candidates using the PEG ratio and other quantitative metrics, rigorous qualitative due diligence is essential. This involves:
- Reading Financial Reports: Delve into the company’s 10-K and 10-Q filings (annual and quarterly reports) to understand its financial performance, risks, and management discussions.
- Analyzing Industry Trends: Understand the competitive landscape, market size, growth prospects of the industry, and any regulatory or technological changes that might impact the company.
- Assessing Management Quality: Research the executive team, their track record, and corporate governance practices.
- Understanding the Business Model: Clearly articulate how the company makes money, its competitive advantages (moat), and its future strategy.
Understanding the Business
Ultimately, successful investing often comes down to understanding the underlying business. The PEG ratio provides a numerical shorthand for valuation relative to growth, but it cannot replace a deep understanding of what a company does, its market position, and its ability to execute its strategy over the long term. By combining the insights from the PEG ratio with thorough fundamental and qualitative analysis, investors can make more informed and robust investment decisions.
aViewFromTheCave is a participant in the Amazon Services LLC Associates Program, an affiliate advertising program designed to provide a means for sites to earn advertising fees by advertising and linking to Amazon.com. Amazon, the Amazon logo, AmazonSupply, and the AmazonSupply logo are trademarks of Amazon.com, Inc. or its affiliates. As an Amazon Associate we earn affiliate commissions from qualifying purchases.