
EBITDA, or Earnings Before Interest, Taxes, Depreciation, and Amortization, is a critical financial metric for evaluating a company’s operational profitability and cash flow potential. While a higher EBITDA margin generally indicates a more efficient and profitable business, what constitutes a “good” margin is not universal. It varies significantly across different industries, largely due to diverse business models, capital requirements, cost structures, and competitive landscapes. Understanding these industry-specific nuances is essential for accurate financial analysis, investment decisions, and strategic planning.
Understanding EBITDA: A Core Metric for Business Health
EBITDA serves as a useful proxy for the cash generated from a company’s core operations before the impact of financing decisions, tax policies, and non-cash expenses like depreciation and amortization. It strips away these variables to provide a clearer picture of a business’s operational performance.
What is EBITDA?
EBITDA is calculated by taking a company’s net income and adding back interest expense, tax expense, depreciation, and amortization. The formula is:
EBITDA = Net Income + Interest Expense + Tax Expense + Depreciation + Amortization
Alternatively, it can be derived from operating income (EBIT):
EBITDA = EBIT + Depreciation + Amortization
This metric helps analysts and investors compare the operational profitability of companies with different capital structures, tax burdens, or asset bases, especially in capital-intensive industries.
Why EBITDA Matters
EBITDA is particularly valuable for several reasons:
- Operational Focus: It highlights the profitability of a company’s core operations, separate from how it is financed (interest), taxed (taxes), or how its assets are depreciated (depreciation and amortization).
- Comparability: It facilitates comparison between companies in the same industry, regardless of their debt levels, tax jurisdictions, or accounting policies for assets.
- Cash Flow Proxy: While not a direct measure of cash flow, it often serves as a quick proxy for a company’s ability to generate cash from its operations, especially before significant capital expenditures.
- Valuation: EBITDA is a key component in many valuation multiples, such as Enterprise Value (EV)/EBITDA, which are commonly used in mergers and acquisitions (M&A) and equity analysis.
EBITDA Margin Calculation and Interpretation
The EBITDA margin expresses EBITDA as a percentage of total revenue, providing insight into how much operational profit a company generates for every dollar of sales.
EBITDA Margin = (EBITDA / Revenue) × 100%
A higher EBITDA margin generally indicates better operational efficiency and stronger pricing power. However, interpretation must always be contextualized by the industry. A 15% EBITDA margin might be excellent in one sector and merely average in another.
Industry Specifics: Why Context is King for EBITDA Margins
The variability in EBITDA margins across industries is not arbitrary; it’s a direct reflection of fundamental differences in business models, cost structures, and market dynamics.
Capital-Intensive Industries vs. Service-Based Businesses
- Capital-Intensive Industries (e.g., Manufacturing, Energy, Telecommunications): These sectors require substantial upfront investment in property, plant, and equipment. While depreciation and amortization are added back to calculate EBITDA, the underlying capital intensity often translates to higher operating costs (maintenance, raw materials) and slimmer margins relative to revenue. For these industries, a “good” EBITDA margin might range from 10% to 25%. Lower margins are often acceptable because the absolute dollar figures of EBITDA can still be substantial due to massive revenues.
- Service-Based Businesses (e.g., Software, Consulting, Marketing Agencies): These typically have lower capital requirements and fewer physical assets. Their primary costs are often related to human capital (salaries), technology, and marketing. With lower cost of goods sold (COGS) and often recurring revenue models (especially software as a service – SaaS), these businesses can achieve significantly higher EBITDA margins, sometimes ranging from 25% to 50% or even higher for highly scalable software firms.
The Impact of Business Models
- High Fixed Costs vs. High Variable Costs: Industries with high fixed costs (e.g., airlines, utilities) need high revenue volumes to achieve profitability, but once that threshold is met, incremental revenue can lead to very high margins. Industries with high variable costs (e.g., retail, food service) often have lower margins as a percentage of revenue, as costs scale directly with sales.
- Pricing Power and Competition: Industries with strong pricing power due to intellectual property, brand recognition, or limited competition (e.g., pharmaceuticals, luxury goods) can often command higher margins. Highly competitive, commoditized industries (e.g., basic materials, some retail segments) typically see intense price competition, driving down margins.
- Regulatory Environment: Heavily regulated industries (e.g., utilities, banking) may have stable revenue streams but often operate under strict pricing controls or capital requirements that limit their maximum achievable margins.

Growth Stages and Market Dynamics
A company’s stage of growth can also influence its EBITDA margin. Fast-growing startups, even in high-margin sectors, might intentionally operate with negative or low EBITDA margins as they aggressively reinvest in R&D, sales, and marketing to capture market share. Mature companies, on the other hand, are expected to demonstrate consistent and often higher EBITDA margins as they focus on efficiency and profitability. Economic cycles, technological disruptions, and shifts in consumer preferences further contribute to margin volatility within industries.
Benchmarking Success: Typical EBITDA Margins Across Key Sectors
While these figures are broad generalizations and can fluctuate, they offer a general guide for what constitutes a “good” EBITDA margin in various industries.
- Technology & Software (SaaS): Often seen as high-margin businesses. Many successful SaaS companies target EBITDA margins of 25-50% or even higher as they scale. This is due to low marginal costs for software, recurring revenue models, and often strong pricing power. Early-stage tech companies, however, may have negative margins due to heavy R&D and customer acquisition costs.
- Retail & Consumer Goods: These industries typically operate on thinner margins due to intense competition, high inventory costs, supply chain complexities, and significant marketing expenses. A “good” EBITDA margin might be in the range of 5-15%. Premium brands or niche retailers might achieve higher, while discount retailers or grocery stores might be at the lower end.
- Manufacturing & Industrials: Margins here vary widely based on the specific product, level of automation, and capital intensity. Generally, an EBITDA margin of 10-20% is considered solid. Specialized manufacturing with proprietary technology might exceed this, while commoditized segments might be lower.
- Healthcare (Providers & Services): Hospitals, clinics, and service providers often have margins influenced by reimbursement rates, labor costs, and regulatory compliance. Margins can range from 10-25%. Pharmaceutical and medical device companies, benefiting from intellectual property and R&D, can achieve significantly higher margins, sometimes 30-50% or more.
- Energy & Utilities: These are highly capital-intensive sectors with substantial infrastructure costs. While revenues can be immense, margins can be moderate to strong. For utilities, a 15-30% EBITDA margin might be typical. Oil and gas exploration and production companies are highly cyclical, but can see 20-40% or higher during peak commodity prices.
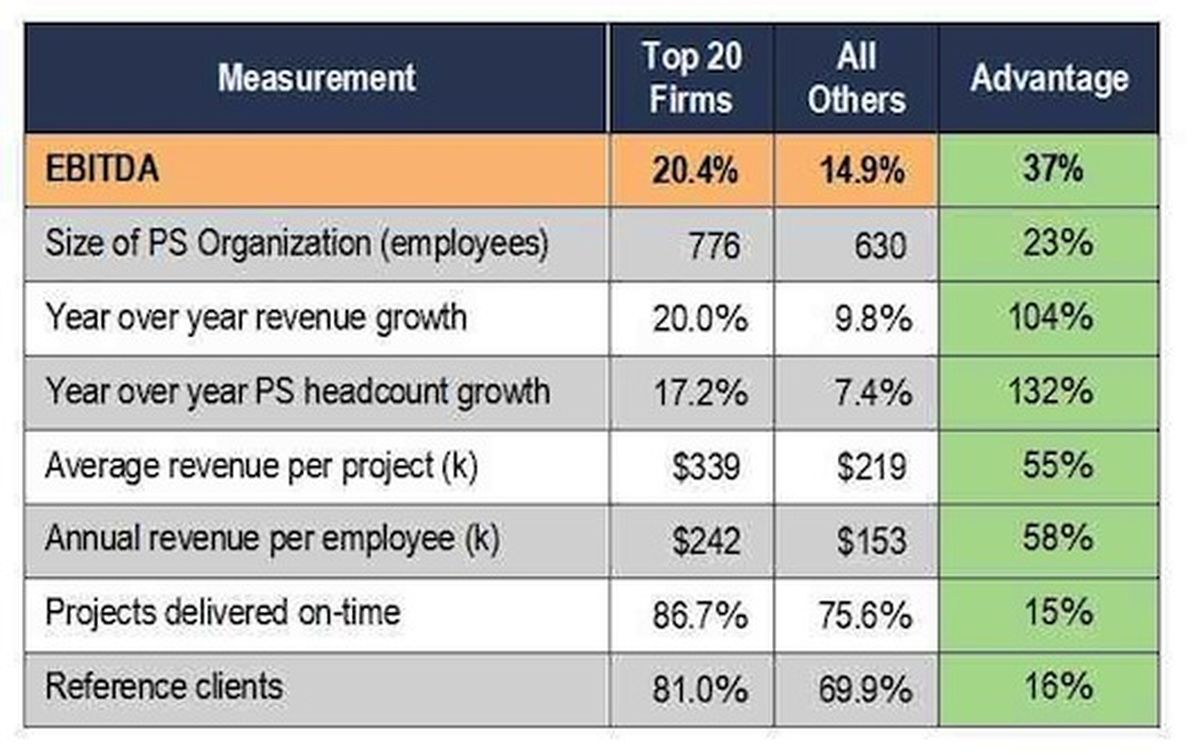
- Professional Services (Consulting, Marketing, Law): These businesses rely heavily on human capital. With relatively low capital expenditure requirements, successful firms can achieve strong EBITDA margins, often in the range of 20-35%, depending on their specialization, pricing, and operational leverage.
- Construction: This industry is highly project-based and can be volatile. Margins often reflect the risk profile of projects. A “good” EBITDA margin might be in the range of 5-10%, with higher-margin projects involving specialized skills or complex engineering.
Beyond the Numbers: Qualitative Factors Influencing EBITDA Margins
While numerical benchmarks are helpful, a comprehensive analysis of EBITDA margins requires considering the underlying qualitative factors that drive these figures.
Competitive Landscape and Economic Moats
The presence of strong “economic moats” – competitive advantages that protect a company’s long-term profits and market share – directly impacts its ability to sustain and grow its EBITDA margin. These moats can include strong brands, proprietary technology, network effects, cost advantages, or high switching costs for customers. Companies operating in highly fragmented or commoditized markets often struggle to maintain high margins due to intense price competition.
Operational Efficiency and Cost Management
A robust EBITDA margin is a testament to effective operational management. This includes optimizing supply chains, controlling labor costs, negotiating favorable terms with suppliers, and streamlining production processes. Businesses that can consistently improve their efficiency, often through technological adoption and lean methodologies, tend to exhibit healthier margins regardless of their industry.
Pricing Power and Value Proposition
A company’s ability to set and maintain premium pricing for its products or services without significant loss of market share is a strong indicator of its value proposition and pricing power. This directly translates to higher gross margins and, subsequently, higher EBITDA margins. Strong brands, differentiated products, superior customer service, and innovative offerings all contribute to pricing power.
Future Growth Prospects and Reinvestment Needs
For rapidly growing companies, particularly in tech, lower current EBITDA margins might be strategically acceptable or even desirable if they are reinvesting heavily in R&D, sales, and marketing to capture future market share. This aggressive reinvestment, while impacting current profitability, aims to establish a dominant position that will yield significantly higher margins in the long term. Conversely, a high EBITDA margin in a stagnant industry might indicate a lack of future growth opportunities or insufficient reinvestment.
Leveraging EBITDA for Strategic Decision-Making and Valuation
EBITDA is a powerful tool for various stakeholders, but its utility is maximized when understood within its proper context and limitations.
Investor Perspective: What Investors Look For
Investors often use EBITDA and EBITDA margins to:
- Assess operational health: A consistent or improving EBITDA margin indicates a well-run business.
- Compare investment opportunities: It allows for a more “apples-to-apples” comparison of companies within the same sector, regardless of their financial structures.
- Estimate valuation: EV/EBITDA multiples are widely used to value companies for M&A, private equity, and public market analysis. A higher EBITDA often translates to a higher valuation, especially when paired with strong growth prospects.
- Evaluate debt capacity: Lenders often look at a company’s EBITDA generation to assess its ability to service debt.
Management Perspective: Driving Operational Improvement
For business leaders, EBITDA margin is a key performance indicator (KPI) that informs strategic decisions:
- Cost Control: Monitoring the margin helps identify areas where operational costs are eating into profitability.
- Pricing Strategy: Understanding how pricing changes affect the margin can guide sales and marketing efforts.
- Investment Decisions: Evaluating potential acquisitions or new projects based on their projected impact on EBITDA margin helps prioritize initiatives that enhance operational profitability.
- Benchmarking: Comparing the company’s EBITDA margin against industry peers provides insight into competitive positioning and areas for improvement.

Limitations of EBITDA: When to Look Deeper
While valuable, EBITDA is not a perfect metric. It explicitly excludes depreciation and amortization, which are real costs of using assets over time and must eventually be replaced (capital expenditures). It also ignores interest expenses (the cost of debt) and taxes. A company with high EBITDA but massive debt obligations and high capital expenditure needs might still struggle with cash flow. Therefore, it’s crucial to analyze EBITDA in conjunction with other financial statements, including the cash flow statement, and consider metrics like Free Cash Flow (FCF) and Net Income for a holistic financial picture.
In conclusion, a “good” EBITDA margin is a relative concept, profoundly shaped by the industry in which a business operates. By understanding industry benchmarks, underlying business models, and qualitative drivers, investors and managers can leverage this powerful metric to make more informed financial decisions and accurately assess operational performance.
aViewFromTheCave is a participant in the Amazon Services LLC Associates Program, an affiliate advertising program designed to provide a means for sites to earn advertising fees by advertising and linking to Amazon.com. Amazon, the Amazon logo, AmazonSupply, and the AmazonSupply logo are trademarks of Amazon.com, Inc. or its affiliates. As an Amazon Associate we earn affiliate commissions from qualifying purchases.