
Understanding revenue within a dealership context is fundamental to grasping its financial health and operational dynamics. Far from being a simple tally of sales, dealer revenue is a multifaceted concept, encompassing various streams, intricate accounting principles, and strategic implications that demand a comprehensive breakdown. In essence, revenue for a dealer represents the total income generated from its primary business activities before any expenses, such as the cost of goods sold, operating costs, or taxes, are subtracted.
Beyond the Sticker Price: Unpacking Dealer Revenue
While many perceive a dealer’s revenue as solely the price paid for a product, the reality is more nuanced. It involves a clear distinction between the gross figures generated and the net amounts recognized, alongside the various channels through which these funds flow.
Gross Revenue vs. Net Revenue
Gross revenue in a dealership is the total amount of money received or receivable from all sales of goods and services over a specific period, without any deductions. For instance, if an automotive dealer sells a car for $30,000, that $30,000 contributes to gross revenue. However, this figure doesn’t tell the full story. Net revenue, conversely, is gross revenue less any sales returns, allowances, discounts, or other reductions. If a customer returns a product, or if a discount was applied to a sale, these reduce the gross revenue to arrive at the net revenue figure. For dealers, understanding this distinction is crucial because profitability is ultimately derived from net revenue after all direct and indirect costs.
The Core Definition
At its heart, revenue for a dealer is the top-line figure reflecting the economic benefit earned from the sale of its core offerings. This can range from physical products like vehicles, machinery, or consumer goods, to services such as maintenance, repairs, and financial product facilitation. It’s the lifeblood that fuels the dealership’s operations, covers its expenses, and, hopefully, contributes to its overall profit. Without sufficient and strategically generated revenue, a dealership cannot sustain itself, invest in growth, or provide value to its stakeholders.
Diverse Streams: Where Dealer Revenue Comes From
Unlike many businesses with a single primary revenue stream, dealers, especially those in complex sectors like automotive or heavy equipment, often generate income from multiple, distinct sources. This diversification is key to their resilience and profitability.
New Unit Sales
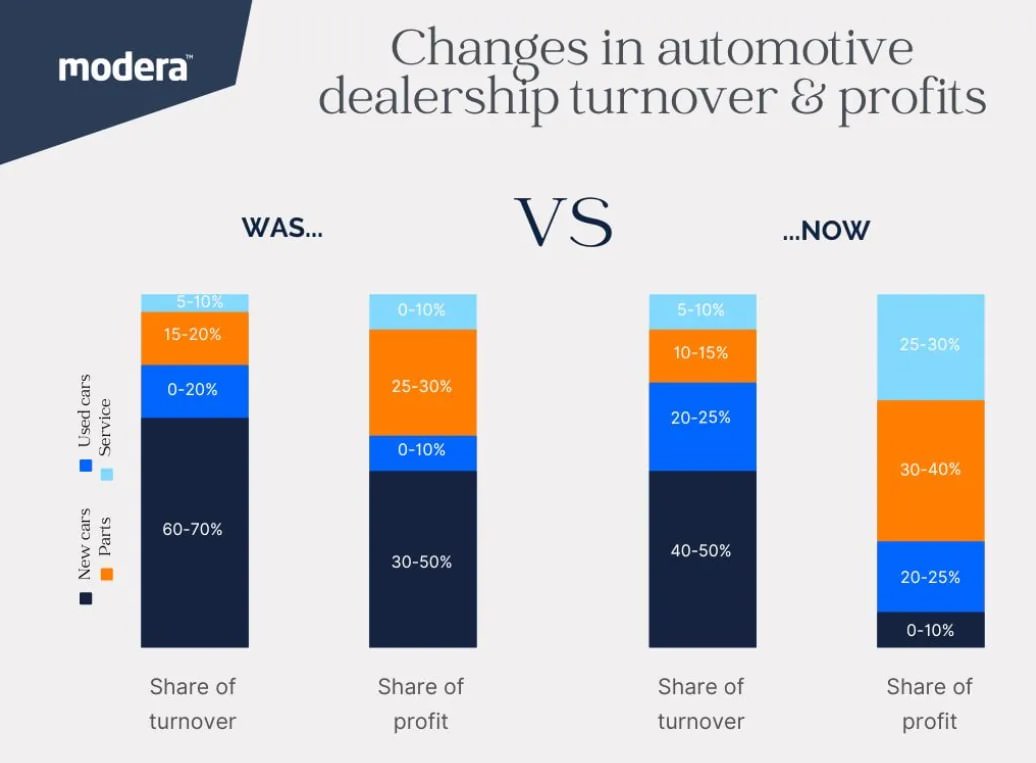
This is often considered the flagship revenue stream for many dealerships. It comprises the income generated from selling brand-new vehicles, equipment, or products directly from the manufacturer. While the sheer volume of new unit sales can significantly boost top-line revenue, the gross profit margins on individual new units can sometimes be thinner compared to other departments, especially in competitive markets where aggressive pricing is common. The strategy here often focuses on volume and manufacturer incentives.
Used Unit Sales
Used unit sales represent a vital, often highly profitable, revenue stream. Dealers acquire used units through trade-ins, auctions, or direct purchases. The ability to recondition these units efficiently and sell them at a competitive price often results in higher gross profit margins per unit than new unit sales. This department’s success hinges on shrewd purchasing, effective reconditioning, and robust marketing to attract buyers seeking value.
Service and Parts Department Revenue
For many dealers, the service and parts department is a consistently strong contributor to both revenue and, critically, profit. This stream includes income from vehicle or product maintenance, repairs, warranty work, accessory sales, and the sale of replacement parts. Service departments often boast higher gross profit margins than unit sales departments because the labor component and parts markup can be substantial. Furthermore, service revenue builds customer loyalty and provides a steady income stream independent of the fluctuations in new and used unit sales.
Finance and Insurance (F&I) Revenue
Particularly prominent in automotive and equipment dealerships, the Finance and Insurance (F&I) department generates substantial revenue through the facilitation of financing, leasing, and the sale of various protection products. This includes commissions on loans and leases arranged through third-party lenders, sales of extended warranties, vehicle service contracts, gap insurance, paint protection, and other ancillary products. F&I is often a high-margin business, as the cost of sales for these products is relatively low compared to the income generated, making it a critical profit center.
Other Ancillary Revenue
Beyond these core streams, dealers may tap into various ancillary sources. This could include rental income from loaner vehicles or specialized equipment, revenue from body shop operations (if integrated), fleet sales to corporate clients, and sometimes even the sale of branded merchandise. While these might individually be smaller contributions, collectively they can enhance overall revenue stability and diversity.
The Critical Relationship: Revenue, Cost, and Margin
Understanding revenue in isolation is insufficient; its true financial meaning emerges when viewed in relation to costs, leading to the calculation of gross profit. This metric reveals the actual profitability of each revenue stream.
Cost of Goods Sold (COGS) in a Dealer Context
Cost of Goods Sold (COGS) for a dealer typically includes the direct costs attributable to the production of goods sold. For a product dealer, this is primarily the acquisition cost of the inventory (e.g., the price paid for a new car from the manufacturer or a used car at auction). It also includes any direct costs associated with making that inventory ready for sale, such as reconditioning expenses for used vehicles (parts, labor), transportation costs, and sometimes even applicable sales commissions directly tied to the sale of the unit.
Gross Profit Calculation
Gross profit is the crucial link between revenue and true profitability. It is calculated by subtracting the Cost of Goods Sold (COGS) from net revenue.
- Gross Profit = Net Revenue – Cost of Goods Sold (COGS)
This figure represents the profit a dealer makes from selling its goods or services before considering any operating expenses like rent, utilities, salaries (not directly tied to COGS), marketing, or administrative costs. A high gross profit margin indicates effective purchasing, pricing, and inventory management.
Understanding Different Margin Profiles
Not all revenue streams yield the same gross profit margin. For instance, new unit sales often have lower gross margins due to competitive pricing and manufacturer rebates, which can reduce the dealer’s initial profit. Used unit sales frequently offer higher gross margins because the dealer has more control over the acquisition cost and reconditioning process. Service and parts departments typically boast the highest gross margins due to the value of skilled labor and markup on parts. F&I products, with their relatively low direct cost, can also yield exceptionally high margins. Analyzing these distinct margin profiles allows dealers to identify their most profitable areas and strategize accordingly.
Revenue Recognition: When Does it Count?
For accurate financial reporting and compliance, dealers must adhere to specific accounting principles regarding when revenue is officially recognized and recorded. This isn’t always as simple as when cash changes hands.
Point of Sale
The most common principle for revenue recognition in a dealer setting is the point of sale. Revenue is typically recognized when the significant risks and rewards of ownership have transferred from the dealer to the customer. This generally occurs when the product is delivered to the customer, and the customer takes legal possession. At this point, the dealer has largely completed its obligation, and the earnings process is considered complete or substantially complete.
Accrual Basis Accounting
Most dealers operate under the accrual basis of accounting, rather than the cash basis. Under accrual accounting, revenue is recognized when it is earned, regardless of when the cash is actually received. Similarly, expenses are recognized when they are incurred, regardless of when cash is paid. This means that if a dealer sells a car on credit, the revenue is recorded at the point of sale, even if the customer will pay for it in installments over several years (though the cash flow will be staggered, the revenue is recognized upfront for the sale).
Contractual Obligations and Multiple Element Arrangements
For certain revenue streams, especially in F&I or service contracts, revenue recognition can be more complex. For instance, an extended warranty sold by the dealer might involve a contractual obligation over several years. The revenue from such products may not be recognized entirely at the point of sale but rather deferred and recognized systematically over the life of the contract, or upon the fulfillment of specific performance obligations, in accordance with accounting standards like ASC 606 (IFRS 15 internationally). This ensures that revenue is matched with the period in which the service or benefit is provided.
Analyzing Dealer Revenue for Strategic Growth
Simply generating revenue is one thing; effectively analyzing it to drive business decisions and foster growth is another. Robust revenue analysis is a cornerstone of strategic dealership management.
Key Revenue Metrics and KPIs
Dealers utilize various key performance indicators (KPIs) to measure and evaluate their revenue performance. Examples include:
- Revenue per Unit (RPU): Total revenue divided by the number of units sold, providing insight into average transaction value.
- Gross Profit per Unit (GPU): Total gross profit divided by units sold, a critical measure of profitability on each sale.
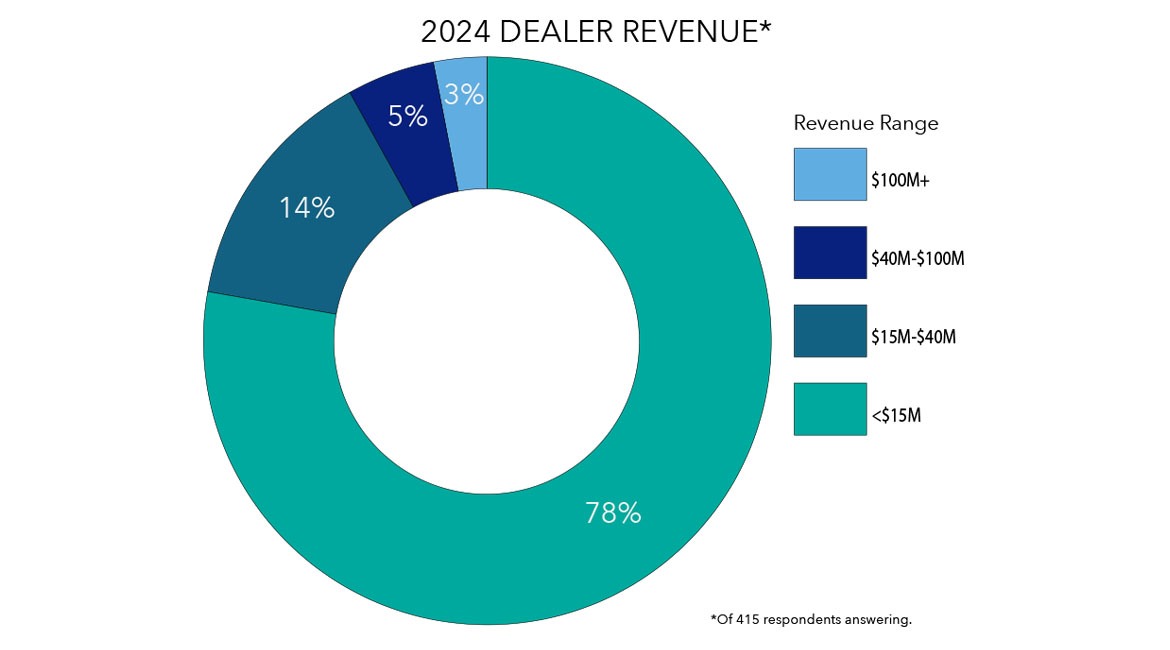
- Departmental Revenue Splits: Analyzing the percentage of total revenue contributed by new sales, used sales, service, and F&I helps understand the business mix.
- Year-over-Year (YoY) Growth: Comparing current period revenue to the same period in the previous year to identify trends and assess growth trajectory.
- Revenue from Repeat Customers: An indicator of customer loyalty and the effectiveness of post-sale engagement.
Identifying Strengths and Weaknesses
Through meticulous revenue analysis, dealers can pinpoint which departments or product lines are thriving and which might be underperforming. For example, if new unit sales revenue is up but overall gross profit is flat, it might suggest overly aggressive discounting. Conversely, if service revenue is lagging, it could indicate issues with customer retention, service capacity, or marketing efforts for that department. This diagnostic capability is essential for targeted intervention.
Strategic Implications
The insights derived from revenue analysis directly inform strategic decisions. Understanding revenue patterns can guide:
- Inventory Management: Adjusting purchasing based on the profitability and sales velocity of certain product types.
- Pricing Strategies: Optimizing pricing for new and used units, as well as service offerings, to maximize both volume and margin.
- Marketing and Sales Focus: Directing resources to promote high-margin departments or to bolster areas with lagging revenue.
- Operational Efficiency: Identifying bottlenecks in the sales or service process that might be hindering revenue capture.
- Investment Decisions: Allocating capital to expand profitable departments or enhance facilities that support key revenue streams.
In conclusion, revenue for a dealer is a dynamic and intricate financial concept that extends far beyond a simple sales figure. It encompasses diverse income streams, adheres to specific accounting principles, and, when properly analyzed, serves as an invaluable tool for strategic planning, performance measurement, and sustainable growth within the competitive dealership landscape.
aViewFromTheCave is a participant in the Amazon Services LLC Associates Program, an affiliate advertising program designed to provide a means for sites to earn advertising fees by advertising and linking to Amazon.com. Amazon, the Amazon logo, AmazonSupply, and the AmazonSupply logo are trademarks of Amazon.com, Inc. or its affiliates. As an Amazon Associate we earn affiliate commissions from qualifying purchases.