
Navigating the landscape of financial markets often introduces investors to a lexicon of terms and indices, each serving as a unique barometer for economic health and market sentiment. Among the most frequently cited are the Nasdaq and the Dow Jones Industrial Average (DJIA). While both are pivotal in assessing market performance, they represent distinct facets of the economy, employ different methodologies, and cater to varying investment perspectives. Understanding their fundamental differences is crucial for any investor seeking to build a well-informed and diversified portfolio.
Foundations of Market Indices
At their core, stock market indices are statistical measures that track the performance of a selected basket of stocks, providing a snapshot of the market or a specific segment within it. They act as proxies for broader market movements, making complex market data digestible and comprehensible.

The Role of Stock Market Indices
Indices serve several vital functions in the financial world. Firstly, they act as benchmarks against which the performance of individual stocks, mutual funds, or portfolios can be measured. An investor might, for instance, compare their portfolio’s annual return to that of the S&P 500 or the Nasdaq Composite to gauge its relative success. Secondly, indices are considered economic indicators. A sustained upward trend in a major index often signals robust economic growth and investor confidence, while a downturn can suggest an impending recession or market instability. Lastly, indices facilitate investment through products like Exchange Traded Funds (ETFs) and index funds, which allow investors to gain diversified exposure to an entire market segment with a single investment, without needing to buy each individual stock.
Definition of an Index
Conceptually, an index is a theoretical portfolio designed to represent a particular segment of the market. It is not something one can directly buy or sell, but rather a calculated value that moves up or down based on the price changes of its constituent stocks. The way these stocks are selected, weighted, and adjusted gives each index its unique character and interpretative value. Some indices are broad, encompassing thousands of companies, while others are narrow, focusing on a handful of industry leaders. This distinction in construction and composition is where the Dow Jones and Nasdaq diverge most significantly.
Delving into the Dow Jones Industrial Average (DJIA)
The Dow Jones Industrial Average holds a storied place in financial history, often colloquially referred to as “the Dow.” It is one of the oldest and most recognized stock market indices globally, frequently cited in news reports as a quick gauge of market health.
History and Composition
The DJIA was created in 1896 by Charles Dow, co-founder of Dow Jones & Company, and editor of The Wall Street Journal. Initially comprising just 12 industrial companies, its purpose was to track the performance of the then-dominant industrial sector of the U.S. economy. Today, the DJIA consists of 30 large, publicly owned companies listed on either the New York Stock Exchange (NYSE) or Nasdaq. These companies are often referred to as “blue-chip” stocks, signifying their reputation for stability, long-term growth, and financial soundness. While the term “industrial” remains in its name, the index’s composition has evolved significantly to reflect the changing U.S. economy, including companies from diverse sectors such as technology, financial services, healthcare, and retail. Iconic names like Apple, Coca-Cola, Goldman Sachs, and Walt Disney are typical constituents.
Price-Weighted Methodology
A key differentiating factor for the DJIA is its unique price-weighted methodology. Unlike most modern indices that are market-capitalization weighted, the Dow’s value is calculated by simply summing the prices of its 30 component stocks and then dividing that sum by a “Dow divisor.” This divisor is adjusted for stock splits, spin-offs, and other structural changes to ensure historical continuity. The critical implication of this method is that stocks with higher share prices have a greater impact on the index’s movement, regardless of their company’s overall market value. For example, if a company with a $300 share price moves up by $1, it will have a more significant impact on the Dow’s total value than a company with a $100 share price moving up by $1, even if the lower-priced stock represents a much larger company by market capitalization.
Limitations of the DJIA
Despite its historical prominence, the DJIA faces several criticisms. Its primary limitation stems from its small number of constituents (only 30 companies), which offers a relatively narrow view of the vast U.S. stock market. This limited scope means it may not fully capture the performance of the broader economy, particularly smaller companies or emerging sectors. Furthermore, its price-weighted nature can lead to distortions. A single stock with a very high share price can disproportionately influence the index’s movements, even if that company represents a smaller fraction of the overall market’ value compared to a lower-priced, but larger market-cap, constituent. This can make the DJIA less representative of the true “market wealth” held by investors.
Investment Implications
For investors, the DJIA serves as an indicator primarily for established, large-cap companies. It can provide insights into the health of traditionally stable, dividend-paying businesses. Investors looking for exposure to mature companies with a track record of consistent earnings might find the Dow’s components appealing. However, relying solely on the DJIA for market analysis or portfolio construction might lead to an underrepresentation of growth sectors and smaller, innovative companies that often drive market innovation and returns.
Understanding the Nasdaq Composite and Nasdaq 100
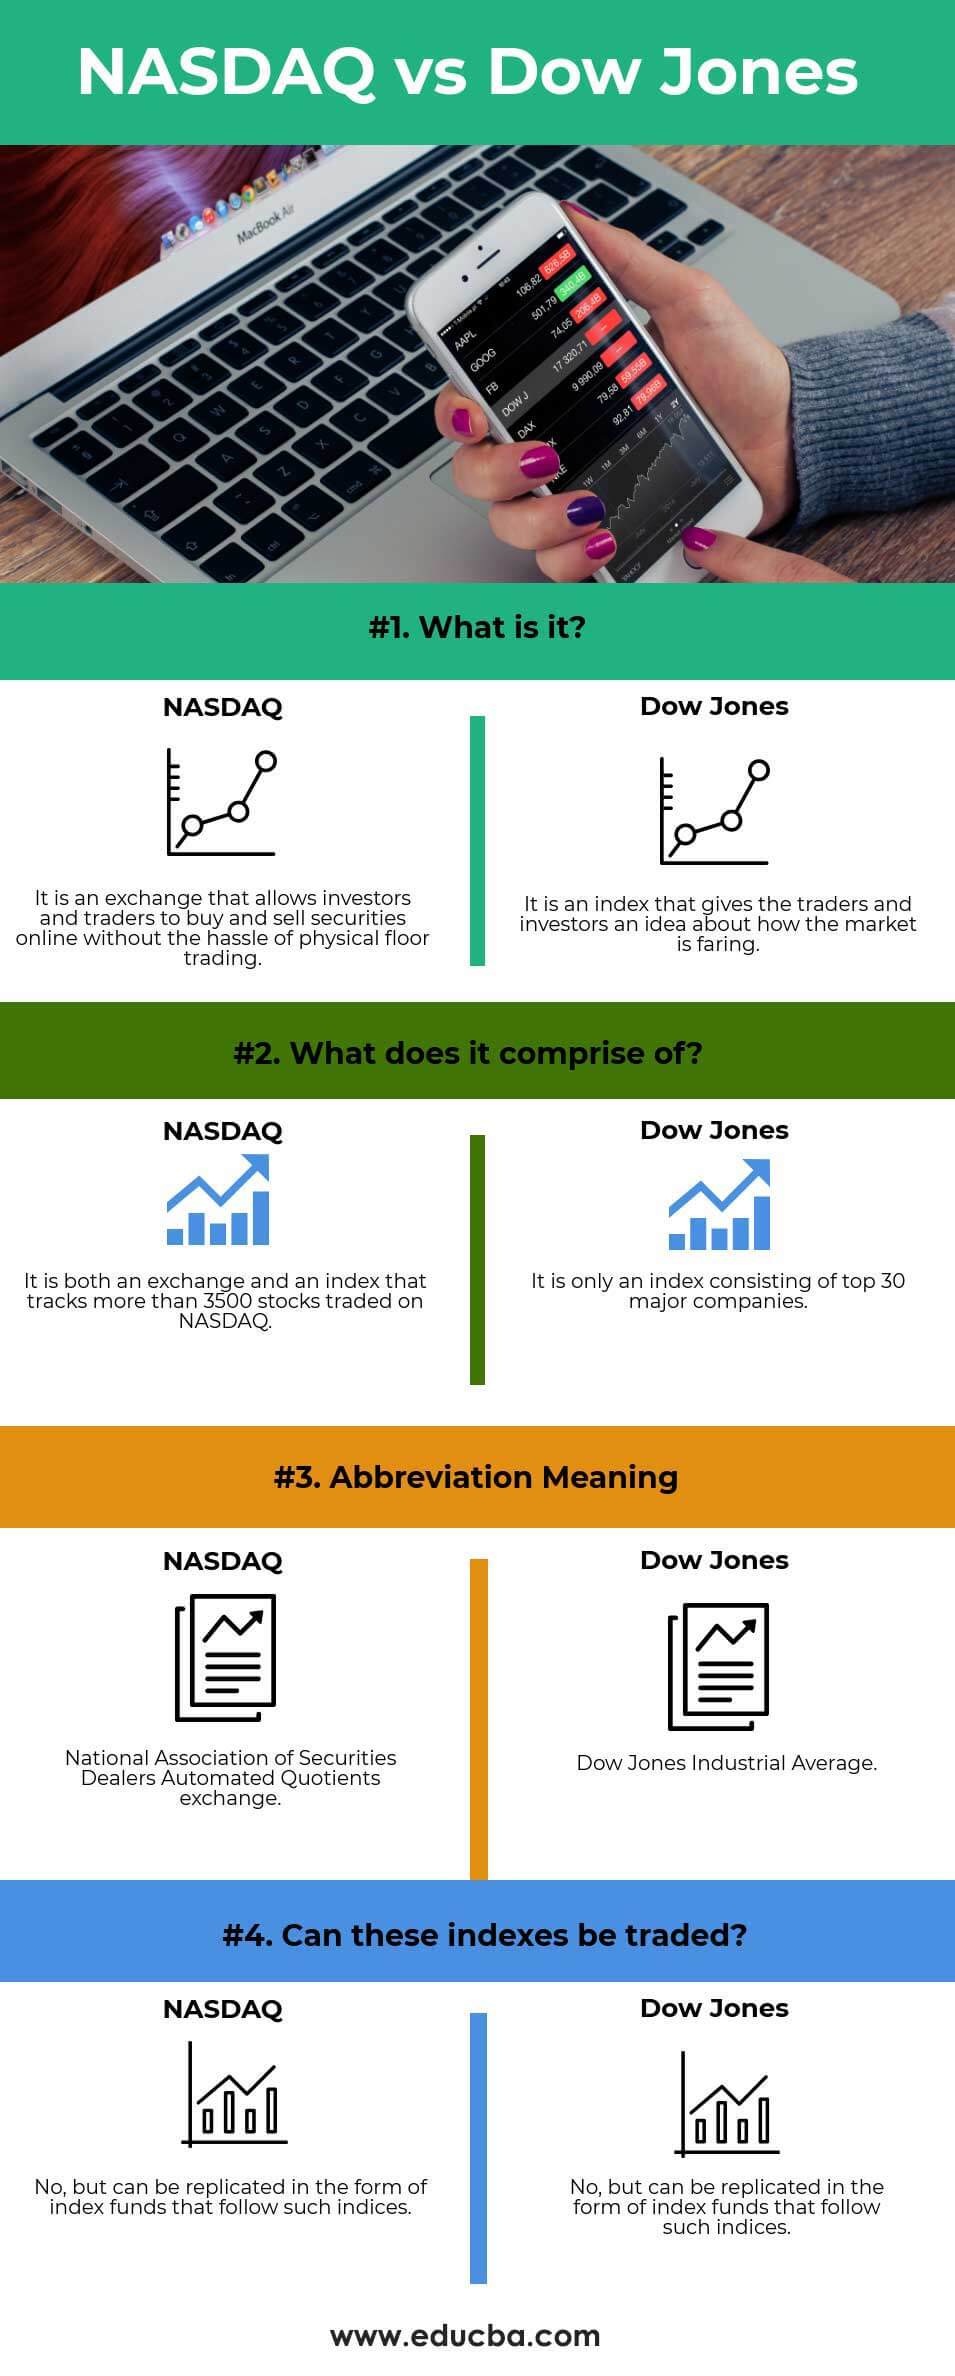
While “Dow Jones” refers to an index family, “Nasdaq” initially refers to an exchange, specifically the National Association of Securities Dealers Automated Quotations. However, within the context of market indices, it most commonly refers to the Nasdaq Composite or the Nasdaq 100.
History and Composition
Launched in 1971, the Nasdaq Stock Market was the world’s first electronic stock market, designed to facilitate trading without a physical trading floor. This innovative approach attracted a new generation of companies, particularly those in the technology sector, which benefited from the streamlined trading process.
The Nasdaq Composite Index is the broadest measure of the Nasdaq exchange’s performance. It includes virtually all common stocks and similar securities listed on the Nasdaq Stock Market, totaling over 3,000 companies. Due to Nasdaq’s history of attracting technology and growth companies, the Composite is heavily weighted towards these sectors, including software, hardware, biotechnology, and internet services.
The Nasdaq 100 Index, a subset of the Nasdaq Composite, is perhaps more frequently cited by investors. It comprises the 100 largest non-financial companies listed on the Nasdaq Stock Market, based on market capitalization. By excluding financial companies, the Nasdaq 100 maintains an even stronger focus on technology and innovation, featuring giants like Apple, Microsoft, Amazon, Google (Alphabet), and Tesla. This makes it a popular benchmark for the performance of large-cap growth stocks and the tech industry specifically.
Market-Capitalization Weighted Methodology
In stark contrast to the DJIA, both the Nasdaq Composite and Nasdaq 100 are market-capitalization weighted. This means that companies with larger market capitalizations (share price multiplied by the number of outstanding shares) have a greater influence on the index’s movements. If Apple, with its multi-trillion-dollar market cap, moves by 1%, it will affect the Nasdaq 100 more significantly than a smaller company moving by the same percentage. This methodology is generally considered to be a more accurate representation of the total wealth created or lost in the market, as it reflects the true economic scale of each company within the index.
Strengths and Volatility
The market-cap weighted methodology of the Nasdaq indices is widely considered a strength, as it provides a more holistic view of the market’s value. The sheer number of constituents in the Nasdaq Composite offers a broad representation of growth-oriented companies. The Nasdaq 100, by focusing on the largest non-financial firms, acts as a bellwether for innovation, high growth, and often disruptive technologies.
However, this focus on growth and technology also contributes to higher volatility compared to broader market indices or the DJIA. Technology stocks, in particular, can be more susceptible to investor sentiment shifts, economic cycles, and regulatory changes, leading to more pronounced swings in the index’s value. Periods of rapid technological advancement often see the Nasdaq outperform, while economic downturns or shifts away from growth investing can lead to sharper declines.
Investment Implications
For investors seeking exposure to innovation, high growth potential, and the technology sector, the Nasdaq indices are indispensable. They represent companies often at the forefront of economic transformation, promising significant returns but also carrying higher risk profiles. Investors might use Nasdaq-tracking ETFs (like QQQ for the Nasdaq 100) to gain concentrated exposure to large-cap tech and growth companies, aligning with strategies focused on long-term capital appreciation from disruptive industries.
Key Distinctions and Comparative Analysis
The fundamental differences between the Nasdaq indices and the Dow Jones Industrial Average are critical for investors to grasp. These distinctions shape how each index reflects market activity and what insights they offer.
Weighting Methodology
This is arguably the most significant difference:
- DJIA: Price-weighted. Higher-priced stocks have a greater impact, regardless of market cap. This can lead to a less representative picture of total market wealth.
- Nasdaq Composite/100: Market-capitalization weighted. Companies with larger total market values (share price x shares outstanding) exert more influence, providing a more accurate reflection of the market’s true scale and economic impact.
Composition and Sector Focus
- DJIA: Comprises 30 “blue-chip” companies from various sectors, historically industrial, but now broadly diversified to include finance, healthcare, and technology. It often represents mature, established industries.
- Nasdaq Composite/100: Heavily concentrated in technology, growth, and innovation-driven companies (biotech, internet, software). The Nasdaq 100 specifically excludes financial companies, further emphasizing its tech and growth bias.
Number of Constituents
- DJIA: A very narrow index with only 30 companies. This limits its representativeness of the overall market.
- Nasdaq Composite: A broad index with over 3,000 companies, representing nearly all stocks listed on the Nasdaq exchange.
- Nasdaq 100: A focused index of 100 of the largest non-financial companies on Nasdaq. While narrower than the Composite, it’s broader than the DJIA and highly influential within its niche.
Exchange vs. Index
- Nasdaq: Is an actual stock exchange where companies list their shares for trading, and it also publishes indices (Composite, 100).
- Dow Jones: Refers to a family of indices managed by S&P Dow Jones Indices. The DJIA is one of many indices published by them, and its constituents can be listed on either the NYSE or Nasdaq.
Market Representation
The DJIA often serves as a quick, albeit sometimes misleading, snapshot of traditional market leaders. The Nasdaq Composite provides a broad view of growth-oriented companies and smaller firms, while the Nasdaq 100 is a powerful indicator for large-cap technology and innovation. An investor looking for a holistic view of the U.S. economy would typically consider a broader index like the S&P 500, which includes a more diversified set of 500 large-cap companies.
Strategic Investment Considerations
Understanding the distinct characteristics of the Nasdaq and Dow Jones is not merely an academic exercise; it has tangible implications for investment strategy, risk management, and portfolio construction.
Diversification and Portfolio Construction
For investors, the differences highlight the importance of diversification. A portfolio heavily weighted towards “blue-chip” Dow stocks might offer stability and dividends but could miss out on the disruptive growth potential found in Nasdaq-listed companies. Conversely, an exclusive focus on Nasdaq stocks, particularly the Nasdaq 100, could lead to a highly concentrated portfolio exposed to the inherent volatility of the tech sector. A balanced approach often involves gaining exposure to both established value companies (which the Dow tends to represent) and high-growth innovation leaders (typical of the Nasdaq) to achieve a diversified risk-return profile.
Economic Indicators
Each index offers unique insights into the economy. The DJIA, with its blend of mature industries, can signal the health of traditional manufacturing, consumer spending, and established corporate earnings. A strong Dow often suggests a stable, perhaps even robust, economy built on conventional foundations. The Nasdaq, conversely, is frequently seen as a forward-looking indicator, reflecting investor sentiment towards innovation, future technologies, and economic growth potential. Its performance often anticipates shifts in economic cycles driven by technological advancements. During periods of rapid tech adoption, a surging Nasdaq might indicate strong investor confidence in future earnings, even if broader economic indicators are mixed.
Risk and Return Profiles
The inherent biases of each index also imply different risk and return profiles. Stocks in the DJIA often belong to companies with long histories, stable earnings, and a propensity to pay dividends, making them attractive to value investors or those seeking income and lower volatility. Nasdaq-listed companies, especially those in the Nasdaq 100, are often characterized by higher growth rates, significant reinvestment into R&D, and potentially higher valuations based on future expectations. While offering substantial upside potential, they also typically carry higher risk, being more sensitive to interest rate changes, market sentiment, and competitive pressures.

ETFs and Index Funds
Investors can gain exposure to these indices through various financial instruments. For the DJIA, the most popular ETF is the SPDR Dow Jones Industrial Average ETF (DIA), which aims to replicate the performance of the index. For the Nasdaq 100, the Invesco QQQ Trust (QQQ) is a widely recognized ETF providing exposure to the 100 largest non-financial companies on the Nasdaq. These ETFs offer a convenient and cost-effective way to invest in diversified baskets of stocks that track these specific market segments, allowing investors to align their portfolios with their views on growth versus value, or tech versus broader industry.
In conclusion, while both the Nasdaq and Dow Jones Industrial Average are crucial metrics for understanding market dynamics, their differences in composition, weighting, and sector focus make them distinct tools. The Dow provides a lens into established industrial giants, while the Nasdaq illuminates the path of technological innovation and growth. A savvy investor appreciates both, using their respective signals to build a comprehensive view of the market and construct a robust, diversified financial strategy.
aViewFromTheCave is a participant in the Amazon Services LLC Associates Program, an affiliate advertising program designed to provide a means for sites to earn advertising fees by advertising and linking to Amazon.com. Amazon, the Amazon logo, AmazonSupply, and the AmazonSupply logo are trademarks of Amazon.com, Inc. or its affiliates. As an Amazon Associate we earn affiliate commissions from qualifying purchases.