
The Cost Performance Index (CPI) stands as a critical metric in the realm of business finance and project management, serving as a powerful indicator of a project’s financial efficiency. At its core, CPI provides a quantitative measure of the cost efficiency of work performed, revealing whether a project is under budget, over budget, or exactly on budget relative to the work accomplished. For any entity, from a small startup managing its inaugural product launch to a multinational corporation overseeing a complex infrastructure project, understanding and effectively utilizing the CPI is paramount for maintaining fiscal discipline and ensuring long-term financial health.
Understanding the Core Concept
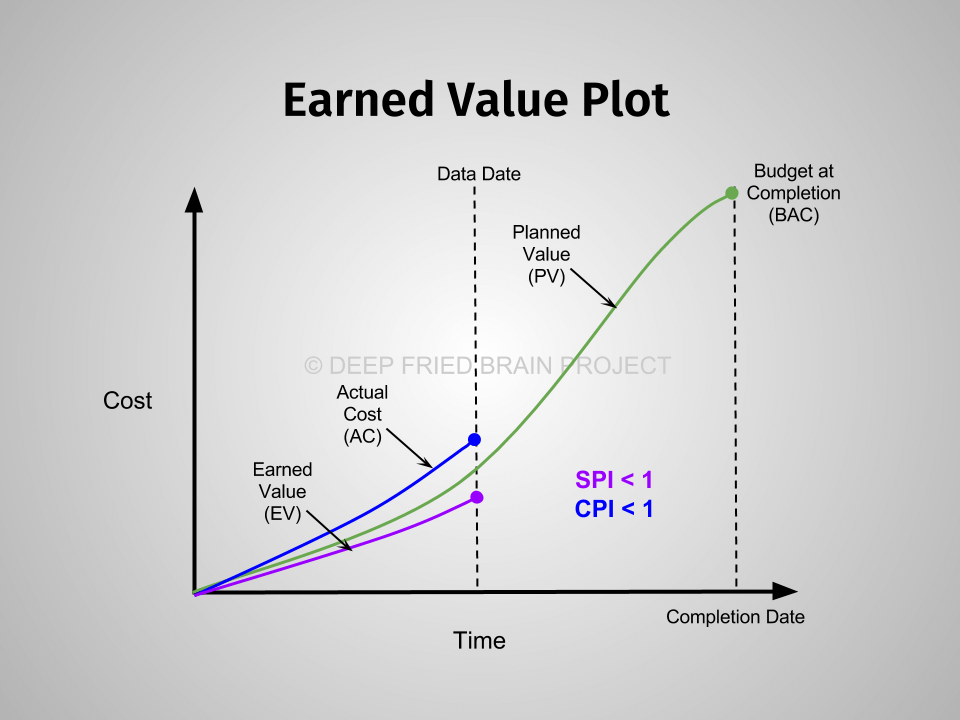
The Cost Performance Index is a component of Earned Value Management (EVM), a project management methodology that integrates scope, schedule, and cost to assess project performance. CPI specifically zeroes in on the financial aspect, providing a clear, concise ratio that reflects how much value is being received for each unit of currency invested.
Definition and Formula
The CPI is calculated using two primary variables: Earned Value (EV) and Actual Cost (AC).
- Earned Value (EV): This represents the value of the work actually performed to date, expressed in terms of the approved budget. It’s the budget associated with the physical work that has been completed. For example, if a task budgeted at $1,000 is 50% complete, its Earned Value is $500.
- Actual Cost (AC): This is the total cost incurred for the work performed up to a specific point in time. It includes all expenses, labor, materials, and any other costs directly attributable to the project activities.
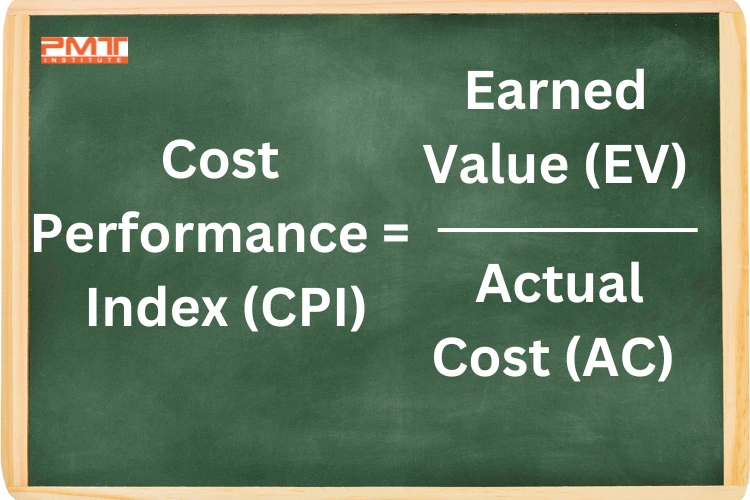
The formula for the Cost Performance Index is:
CPI = Earned Value (EV) / Actual Cost (AC)
This simple ratio provides a profound insight into a project’s financial standing. It answers the fundamental question: for every dollar spent, how much value have we actually created?
Interpreting the CPI Value
The numerical result of the CPI calculation offers an immediate snapshot of financial efficiency:
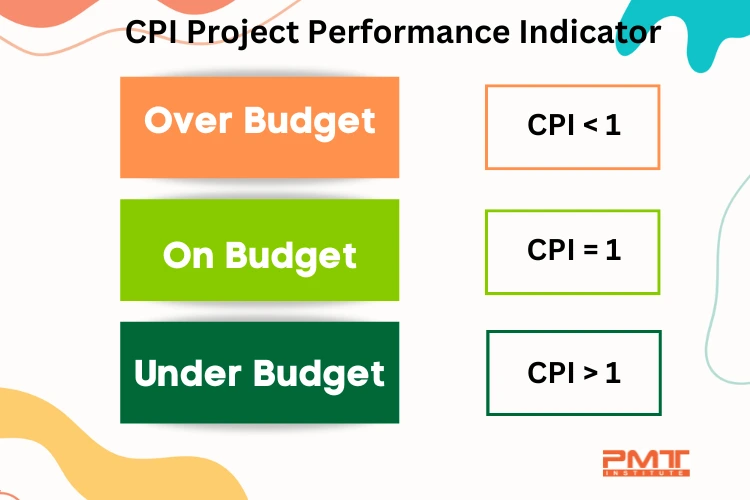
- CPI > 1: This indicates that the project is performing under budget. For every dollar spent, more than a dollar’s worth of value has been earned. For instance, a CPI of 1.25 means that for every $1.00 spent, $1.25 of work has been completed. This is generally a favorable situation, suggesting efficient resource utilization and strong cost control.
- CPI < 1: This signals that the project is performing over budget. For every dollar spent, less than a dollar’s worth of value has been earned. A CPI of 0.80 implies that for every $1.00 spent, only $0.80 of work has been completed. This is an unfavorable situation, indicating cost overruns and potential financial strain if not addressed promptly.
- CPI = 1: This means the project is performing exactly on budget. The value earned is precisely equal to the actual cost incurred. This is the ideal target, representing perfect cost efficiency.
The interpretation of CPI is critical for financial stakeholders, as it provides an unambiguous measure of whether resources are being deployed effectively.
The Importance of CPI in Business Finance
For businesses operating in competitive markets, the ability to manage finances efficiently is not just a desirable trait but a fundamental requirement for survival and growth. CPI plays a pivotal role in this, offering insights that transcend mere accounting and inform strategic financial decisions.
Project Health and Early Warning
One of the most significant contributions of CPI is its ability to act as an early warning system for financial distress within a project. By regularly monitoring CPI, financial managers and project sponsors can quickly identify when a project begins to deviate from its approved budget. A consistently declining CPI can signal systemic issues such as inefficient processes, unexpected material cost increases, scope creep, or poor resource allocation. Early detection of these financial anomalies allows management to intervene proactively, preventing minor issues from escalating into major financial crises. Without such a metric, cost overruns might only become apparent much later in a project’s lifecycle, when corrective actions are far more expensive and challenging to implement.
Budget Management and Forecasting
CPI is an indispensable tool for robust budget management and accurate financial forecasting. When CPI consistently shows a project running over budget (CPI < 1), it necessitates a re-evaluation of the remaining budget and potentially a revision of the Estimate at Completion (EAC). The EAC, often calculated using the CPI, projects the total cost of the project based on current performance. This allows finance departments to prepare for potential budget adjustments, secure additional funding if necessary, or make strategic decisions to cut costs or reduce scope to bring the project back within an acceptable financial range. Conversely, a strong CPI (CPI > 1) might indicate opportunities to reallocate surplus budget to other priority projects or enhance current project deliverables.
Stakeholder Communication and Decision Making
Effective financial communication is vital for maintaining trust and transparency with stakeholders, including investors, executives, and clients. CPI provides a clear, objective, and universally understood metric to communicate a project’s financial health. Rather than subjective descriptions, a project manager can present the CPI to confidently explain how effectively the budget is being utilized. This facilitates informed decision-making, allowing stakeholders to understand the financial implications of project performance and to approve necessary corrective actions or strategic pivots. For investors, a consistently strong CPI across a portfolio of projects signals competent financial management and a higher likelihood of achieving planned returns.
Calculating and Applying CPI in Practice
Implementing CPI effectively requires diligent data collection and a systematic approach to project monitoring. Its practical application extends across various industries, providing a standardized measure of financial performance.
Data Inputs: Earned Value, Actual Cost
The foundation of an accurate CPI calculation lies in reliable data for Earned Value (EV) and Actual Cost (AC).
- Earned Value (EV) Calculation: This is often the more complex input to derive. It requires a clear, measurable work breakdown structure (WBS) with detailed budget allocations for each work package. As work progresses, the percentage completion of each budgeted task must be accurately assessed. EV is then calculated as:
(Percentage Complete) x (Budgeted Cost of Work Scheduled). For example, if a work package is budgeted at $10,000 and is 60% complete, the EV is $6,000. Aggregating these EVs across all completed and partially completed tasks provides the total EV for the project. - Actual Cost (AC) Tracking: This involves precise tracking of all expenditures. This data typically comes from accounting systems, invoices, payroll records, and expense reports. It is crucial to ensure that AC is accurately mapped to the specific work packages or activities for which the EV is being calculated to ensure a direct comparison.
Consistency in defining and measuring EV and AC is paramount. Any discrepancies or inaccuracies in these foundational inputs will render the calculated CPI misleading, potentially leading to flawed financial decisions.
Practical Examples Across Industries
The utility of CPI is not confined to a single industry but is universally applicable wherever projects have defined budgets and scopes.
- Construction: Consider a large commercial building project with a total budget of $50 million. If, after one year, 40% of the physical work (e.g., foundation, structural steel) is completed, but $25 million has already been spent, the CPI would be calculated as:
- EV = 40% of $50 million = $20 million
- AC = $25 million
- CPI = $20 million / $25 million = 0.80
This CPI of 0.80 immediately signals that the project is significantly over budget, incurring $1.25 for every $1.00 of value created. This prompts an urgent financial review.
- Product Development (e.g., Software): For a software product development project budgeted at $2 million, after three months, suppose 25% of the features are fully developed and tested, and the total cost incurred is $600,000.
- EV = 25% of $2 million = $500,000
- AC = $600,000
- CPI = $500,000 / $600,000 = 0.83
Again, a CPI below 1 indicates cost inefficiency, potentially due to scope creep, unforeseen technical challenges, or underestimated effort, requiring financial intervention.
- Marketing Campaign: A marketing agency launches a campaign with a budget of $100,000. After one month, 60% of the planned campaign activities (ad placements, content creation, social media management) are complete, and the actual spend is $50,000.
- EV = 60% of $100,000 = $60,000
- AC = $50,000
- CPI = $60,000 / $50,000 = 1.20
In this scenario, the CPI of 1.20 suggests excellent cost performance, meaning the agency has achieved more value than the money spent, possibly due to effective negotiation with vendors or highly efficient internal processes.
These examples underscore how CPI provides a consistent, comparable metric for financial performance across diverse projects and industries, enabling sound financial oversight.
Limitations and Complementary Metrics
While CPI is a powerful financial tool, it is not a standalone solution for comprehensive project health assessment. Its limitations must be understood, and it should be used in conjunction with other metrics for a holistic view.
CPI’s Focus on Efficiency
The primary limitation of CPI is its singular focus on cost efficiency. It tells us how well we are utilizing our budget relative to the work completed, but it provides no information about other critical project dimensions. For example, a project might have a fantastic CPI of 1.2, indicating it is under budget, but it could simultaneously be running significantly behind schedule. A project that finishes under budget but two years late may still be a financial disaster if the market window has closed or penalties are incurred. Similarly, a project could be on budget (CPI = 1) but delivering poor quality work, which would have long-term financial repercussions. Therefore, relying solely on CPI for financial decision-making can be misleading.
The Role of Schedule Performance Index (SPI) and Variance Analysis
To overcome CPI’s limitations, it is essential to integrate it with other Earned Value Management (EVM) metrics. The most critical complementary metric is the Schedule Performance Index (SPI).
- SPI = Earned Value (EV) / Planned Value (PV)
- Planned Value (PV): This is the budgeted cost of work scheduled to be completed by a given date.
- A CPI of 1.2 and an SPI of 0.7 would tell a very different story than a CPI of 1.2 and an SPI of 1.1. The former indicates excellent cost performance but significant schedule delays, while the latter shows both cost and schedule efficiency.
- Variance Analysis: Beyond these indices, Cost Variance (CV = EV – AC) and Schedule Variance (SV = EV – PV) provide absolute dollar values of budget and schedule deviations, respectively. These variances offer a more direct understanding of the financial impact of overruns or underruns.
By integrating CPI with SPI and detailed variance analysis, finance professionals gain a multi-dimensional understanding of project performance, enabling more nuanced and effective financial strategies. This comprehensive approach helps identify projects that are both financially prudent and progressing on time, or to pinpoint specific areas (cost vs. schedule) that require intervention.
Leveraging CPI for Improved Financial Outcomes
The ultimate goal of calculating and monitoring CPI is not merely to track performance but to drive better financial outcomes. This involves a cycle of measurement, analysis, corrective action, and continuous improvement.
Corrective Actions and Strategic Adjustments
When CPI indicates a project is over budget, financial managers must initiate corrective actions. These actions are diverse and depend heavily on the root cause of the cost inefficiency.
- Identify Root Causes: Is it due to inefficient resource allocation? Unexpected material price increases? Scope creep? Inaccurate initial estimates? High-level analysis often involves diving into the detailed cost accounts and work packages where the overruns are occurring.
- Cost Control Measures: This could involve renegotiating vendor contracts, optimizing procurement processes, implementing more stringent budget approvals, or reassessing resource needs.
- Scope Management: If scope creep is the culprit, discussions with stakeholders to prioritize features or defer non-essential elements might be necessary. Financial teams play a crucial role in quantifying the cost impact of scope changes to enable informed decisions.
- Re-estimation and Forecasting: If the current performance is indicative of future trends, the Estimate at Completion (EAC) will need to be revised, potentially requiring additional funding requests or a re-baselining of the project budget. Financial projections for the organization would also need adjustment.
These strategic adjustments are not punitive but rather proactive steps to steer the project back towards financial viability or to mitigate further losses.
Continuous Improvement and Best Practices
Beyond immediate corrective actions, CPI data can feed into a cycle of continuous financial improvement for the organization.
- Benchmarking: By tracking CPI across multiple projects, organizations can establish internal benchmarks for cost efficiency. This allows for the identification of best practices from high-performing projects that can be replicated elsewhere.
- Refining Estimation Processes: Consistent overruns indicated by low CPI values suggest that initial project cost estimates might be systematically flawed. Data from past project CPIs can inform and refine future estimation models, leading to more accurate budgeting from the outset.
- Process Optimization: Analyzing projects with poor CPI can reveal inefficiencies in operational processes, resource management, or procurement. Addressing these systemic issues can lead to enterprise-wide financial benefits.
- Training and Development: Understanding the causes of cost inefficiencies might highlight a need for better training in project management, financial literacy for project teams, or specific tools and techniques for cost control.
In conclusion, the Cost Performance Index is far more than just a number; it is a vital financial instrument for any business engaged in project-based work. By accurately calculating, interpreting, and acting upon CPI, organizations can not only manage project budgets more effectively but also foster a culture of financial accountability and continuous improvement that underpins long-term financial success.
aViewFromTheCave is a participant in the Amazon Services LLC Associates Program, an affiliate advertising program designed to provide a means for sites to earn advertising fees by advertising and linking to Amazon.com. Amazon, the Amazon logo, AmazonSupply, and the AmazonSupply logo are trademarks of Amazon.com, Inc. or its affiliates. As an Amazon Associate we earn affiliate commissions from qualifying purchases.