
In the intricate world of business finance, where every margin point and operational efficiency can translate into significant gains or losses, understanding the fundamental drivers of profitability is paramount. While often perceived as purely quality control metrics, Cp and Cpk are, at their core, critical financial tools that offer profound insights into a business’s operational health, risk profile, and ultimately, its financial performance. These statistical process control (SPC) indices quantify a process’s ability to produce output within specified limits, directly impacting everything from material waste and rework costs to customer satisfaction and brand reputation—all of which have tangible financial repercussions.

The Financial Imperative of Process Capability
For any manufacturing or service-delivery organization, process capability is not merely an engineering concern; it is a direct contributor to the bottom line. The ability to consistently produce products or deliver services that meet customer specifications, without excessive defects or deviations, is a cornerstone of financial stability and growth. Processes that are incapable incur substantial financial penalties through increased scrap, rework, warranty claims, lost sales due to poor quality, and damage to brand perception. Conversely, highly capable processes minimize these costs, optimize resource utilization, and foster customer loyalty, leading to enhanced profitability and a stronger competitive position. Cp and Cpk provide the quantitative framework to assess this capability and, by extension, the financial health of operational processes.
Beyond Quality: The Cost of Incapability
The “cost of poor quality” (COPQ) is a well-documented financial burden that can erode profits rapidly. This includes internal failure costs (scrap, rework, re-inspection, re-testing), external failure costs (warranty claims, returns, liability, lost reputation), appraisal costs (inspection, auditing), and prevention costs (training, quality planning). Incapable processes directly fuel the internal and external failure costs, creating a continuous drain on financial resources. By identifying and improving processes with low Cp and Cpk values, businesses can directly reduce COPQ, transforming potential losses into savings that boost profitability. This makes Cp and Cpk indispensable “financial tools” for proactive cost management.
Cp: A Baseline for Financial Performance
Process Capability ($C_p$) is a simple, yet powerful, ratio that quantifies the potential capability of a process if it were perfectly centered between its specification limits. It compares the width of the specification limits (the allowable spread) to the width of the process’s natural variation (six standard deviations, representing approximately 99.73% of data if normally distributed).
The formula for Cp is:
$C_p = frac{USL – LSL}{6sigma}$
Where:
- USL = Upper Specification Limit
- LSL = Lower Specification Limit
- $sigma$ = Standard deviation of the process
A higher Cp value indicates a process with greater potential capability. For example, a Cp of 1.0 means the process spread is equal to the specification spread, theoretically leaving no room for error if perfectly centered. A Cp of 1.33 is generally considered the minimum acceptable for many industries, suggesting the process spread is significantly narrower than the specification spread.
From a financial perspective, Cp helps assess the inherent “room for error” built into a process. A low Cp suggests that even with perfect centering, the process will struggle to meet specifications, leading to inevitable waste and increased costs. It signals a fundamental design or operational flaw that requires significant investment in process improvement to become financially viable and competitive. Conversely, a high Cp indicates a robust process with minimal inherent variability, suggesting a lower likelihood of producing defects, thus minimizing future financial losses associated with non-conformance. It’s a key metric for evaluating the financial risk associated with process variability.
Cpk: Accounting for Process Centering and Financial Risk
While Cp provides an excellent measure of potential capability, it assumes the process output is perfectly centered between the specification limits. In reality, processes often drift or are intentionally offset, leading to a higher likelihood of producing defects even if the overall process spread (Cp) is narrow. This is where the Process Capability Index ($C_{pk}$) becomes a more comprehensive and financially significant metric. Cpk takes into account both the process variation and its centering relative to the specification limits.
The formula for Cpk is:
$C_{pk} = text{min}left(frac{USL – mu}{3sigma}, frac{mu – LSL}{3sigma}right)$
Where:
- USL = Upper Specification Limit
- LSL = Lower Specification Limit
- $mu$ = Process mean
- $sigma$ = Standard deviation of the process
Cpk essentially calculates the capability of the process from its mean to the nearest specification limit. It provides a more realistic assessment of current performance and the likelihood of producing out-of-specification products.
Precision and Profitability: Why Cpk Matters More
A high Cp value with a low Cpk value is a financial warning sign. It indicates that while the process could be capable, it is currently operating off-center, leading to a significant portion of output falling outside the specification limits. This directly translates to increased scrap, rework, and potential customer complaints—all of which negatively impact profitability.
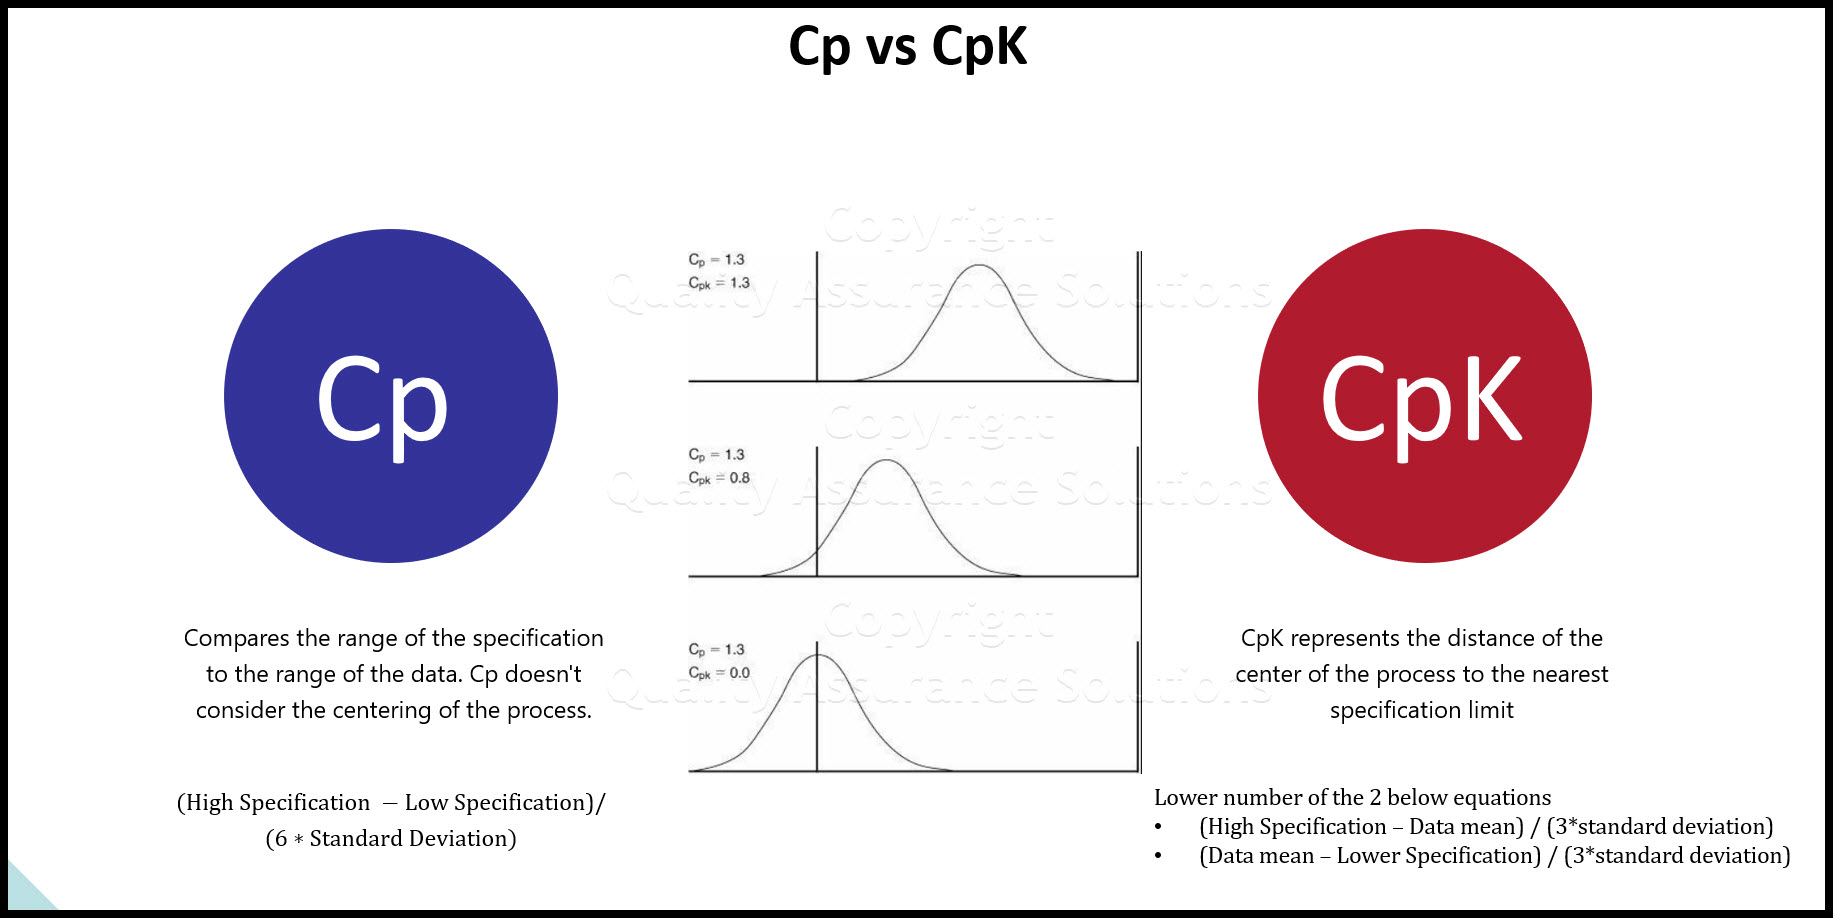
Consider a scenario where a process has a Cp of 2.0 (excellent potential) but a Cpk of 0.8 (poor actual performance). This means the process is consistently biased towards one specification limit. The financial impact is immediate: a high percentage of products will be rejected, leading to substantial material waste, lost labor time, and potential delays in delivery that could result in penalties or loss of future business. For a business finance professional, a low Cpk immediately flags a process as a financial risk, demanding immediate attention to recenter and stabilize its operation. It moves beyond theoretical potential to real-world financial implications.
The Financial Impact of Shifting Averages
The mean ($mu$) in the Cpk calculation is critical. A process mean that consistently shifts, even slightly, towards a specification limit can dramatically reduce Cpk and, by extension, increase financial losses. These shifts can be caused by various factors, such as worn tooling, inconsistent raw materials, operator error, or environmental changes. Monitoring Cpk allows businesses to detect these shifts early, enabling timely intervention to adjust the process mean back to target, thereby preventing the production of costly non-conforming items. This proactive approach to process management, driven by Cpk, directly translates to reduced waste and optimized operational costs, ensuring that capital expenditures and operational budgets are not eroded by preventable defects.
Implementing Cp and Cpk for Business Finance Advantage
Integrating Cp and Cpk into a business’s financial strategy involves more than just understanding the formulas; it’s about leveraging these metrics to drive strategic investment, optimize resource allocation, and enhance overall profitability. They serve as key performance indicators (KPIs) for operational excellence that directly feed into financial reporting and strategic planning.
Strategic Investment in Process Improvement
When Cp or Cpk values are low, they signal areas requiring investment. A low Cp suggests a fundamental design flaw or inherent variability that may necessitate capital investment in new equipment, technology upgrades, or significant process re-engineering. A low Cpk, while potentially easier to fix (e.g., recalibrating equipment, adjusting settings), still requires resources for analysis, adjustment, and ongoing monitoring. Business finance leaders can use these metrics to prioritize investments, allocating capital to improvements that offer the highest return on investment (ROI) by significantly reducing COPQ and improving efficiency. The goal is to move processes towards a Cpk of 1.33 or higher, signifying a robust and financially sound operation.
Reducing Waste, Maximizing ROI
Every non-conforming product represents wasted raw materials, energy, labor, and overhead. By improving Cp and Cpk, businesses directly reduce this waste. This isn’t just about saving pennies; it’s about improving gross margins, enhancing asset utilization, and freeing up capital that would otherwise be tied up in scrap and rework. High Cp and Cpk values are synonymous with lean operations, where resources are used efficiently, and value is maximized at every stage. This directly contributes to a higher ROI on production assets and a stronger financial position for the company.
Enhancing Customer Satisfaction and Brand Value
While not immediately apparent in a balance sheet, customer satisfaction and brand value are invaluable financial assets. Products that consistently meet specifications due to highly capable processes lead to satisfied customers, repeat business, and positive word-of-mouth. Conversely, defects and inconsistent quality—often stemming from low Cpk processes—can damage a brand’s reputation, leading to lost market share and a decline in future revenue. Therefore, improving Cp and Cpk is an indirect yet powerful investment in brand equity and long-term financial stability.
Integrating Cp/Cpk into Your Business Finance Toolkit
For business leaders and financial professionals, Cp and Cpk are not just academic concepts; they are actionable financial tools. They provide a quantitative lens through which to evaluate operational performance, identify areas of financial risk, and justify investments in quality improvement.
From Data to Dollars: Making Informed Decisions
Regular monitoring and reporting of Cp and Cpk should be an integral part of a business’s operational and financial dashboards. Trends in these metrics can forecast financial performance. Declining Cpk, for instance, might indicate an impending increase in production costs and customer returns. Conversely, improving Cpk trends can signal cost reductions and enhanced profitability. Finance teams can use this data to perform more accurate cost analyses, create more realistic budgets, and make informed decisions about pricing, production volumes, and resource allocation.

Continuous Improvement as a Financial Strategy
Embracing Cp and Cpk fosters a culture of continuous improvement, which is a powerful financial strategy. By continually striving to narrow process variation (improve Cp) and keep processes centered (improve Cpk), businesses are perpetually optimizing their operational efficiency and reducing waste. This proactive approach ensures that resources are always being used in the most effective manner, securing long-term cost advantages and sustainable profitability. In essence, Cp and Cpk are not just measures of capability; they are indicators of a business’s commitment to financial excellence and operational resilience.
aViewFromTheCave is a participant in the Amazon Services LLC Associates Program, an affiliate advertising program designed to provide a means for sites to earn advertising fees by advertising and linking to Amazon.com. Amazon, the Amazon logo, AmazonSupply, and the AmazonSupply logo are trademarks of Amazon.com, Inc. or its affiliates. As an Amazon Associate we earn affiliate commissions from qualifying purchases.