Apple Maps, a ubiquitous tool in our digital lives, is more than just a way to get from point A to point B. It’s a sophisticated system that leverages data to provide us with the most efficient and informative navigation possible. Among the various visual cues it employs, the color red often sparks curiosity and sometimes, a touch of concern. What exactly does red signify on Apple Maps, and how does this seemingly simple color tie into the broader landscape of technology, branding, and even our financial decisions?
This article will delve into the meaning behind red on Apple Maps, exploring its immediate navigational implications and then expanding outwards to consider how such color coding and data visualization play a crucial role in the tech industry, how brands utilize color to communicate, and even how understanding these elements can subtly influence our personal finances.
Understanding Red’s Immediate Impact: Traffic Congestion and Road Conditions
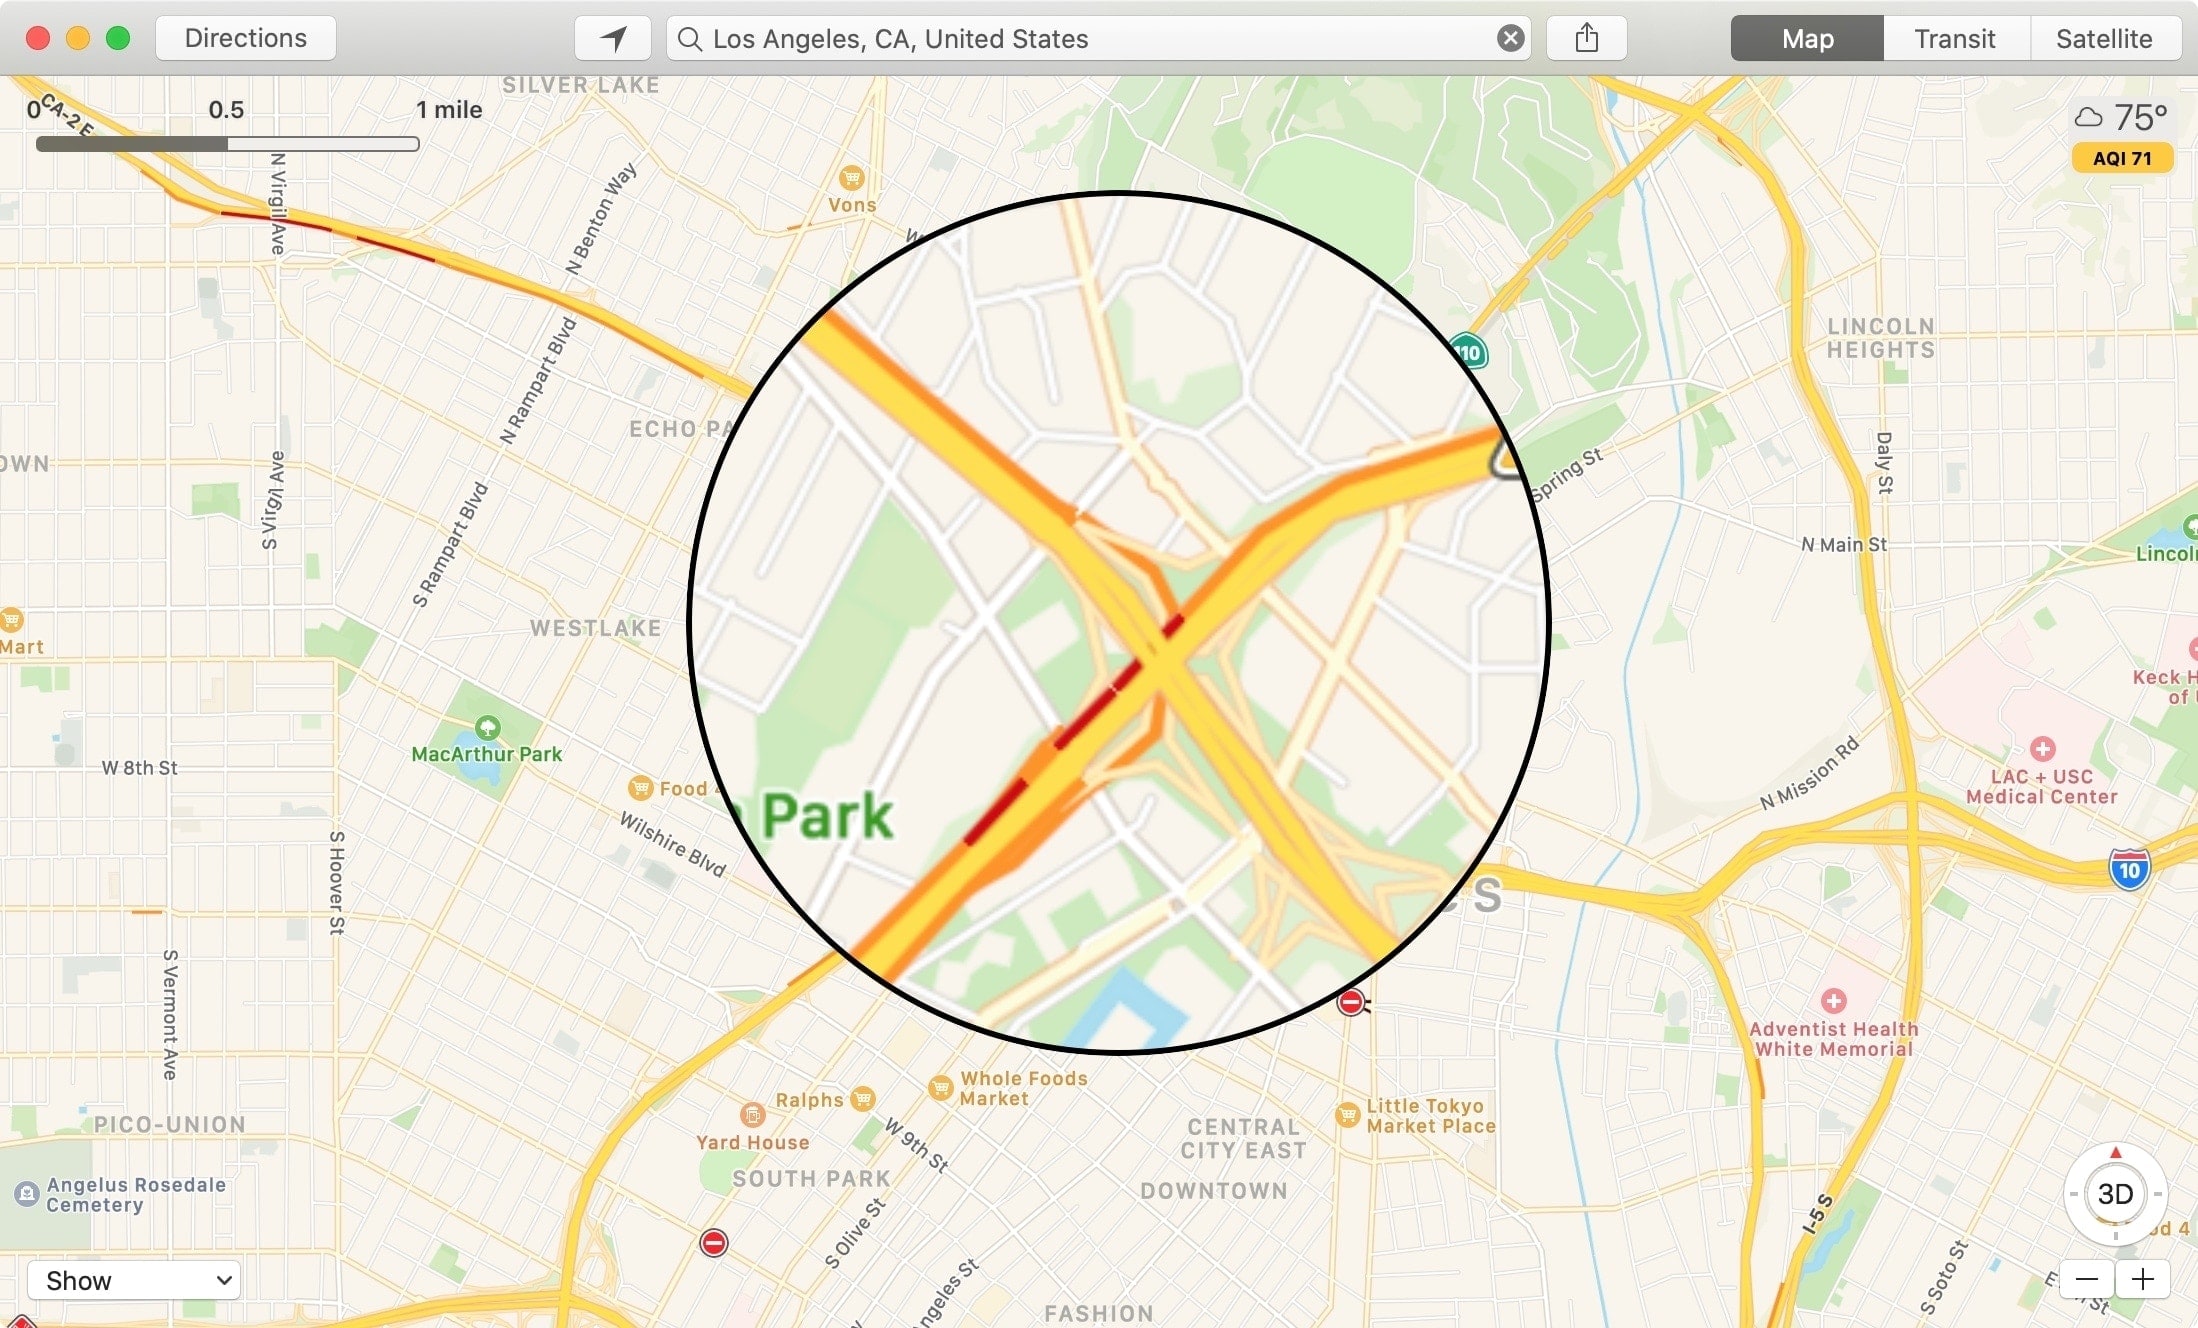
At its most fundamental level, red on Apple Maps is an indicator of traffic. This isn’t just an arbitrary choice; it’s a data-driven representation designed for rapid comprehension. When you’re planning a route or simply viewing the map, segments of roads colored red signal a significant slowdown in traffic flow. This means that the typical travel time for that section is substantially longer than usual.
The Nuances of Red: From Slow to Stop
It’s important to understand that “red” isn’t a monolithic warning. Apple Maps employs a spectrum of colors to represent traffic conditions, and red is generally at the more severe end of this spectrum.
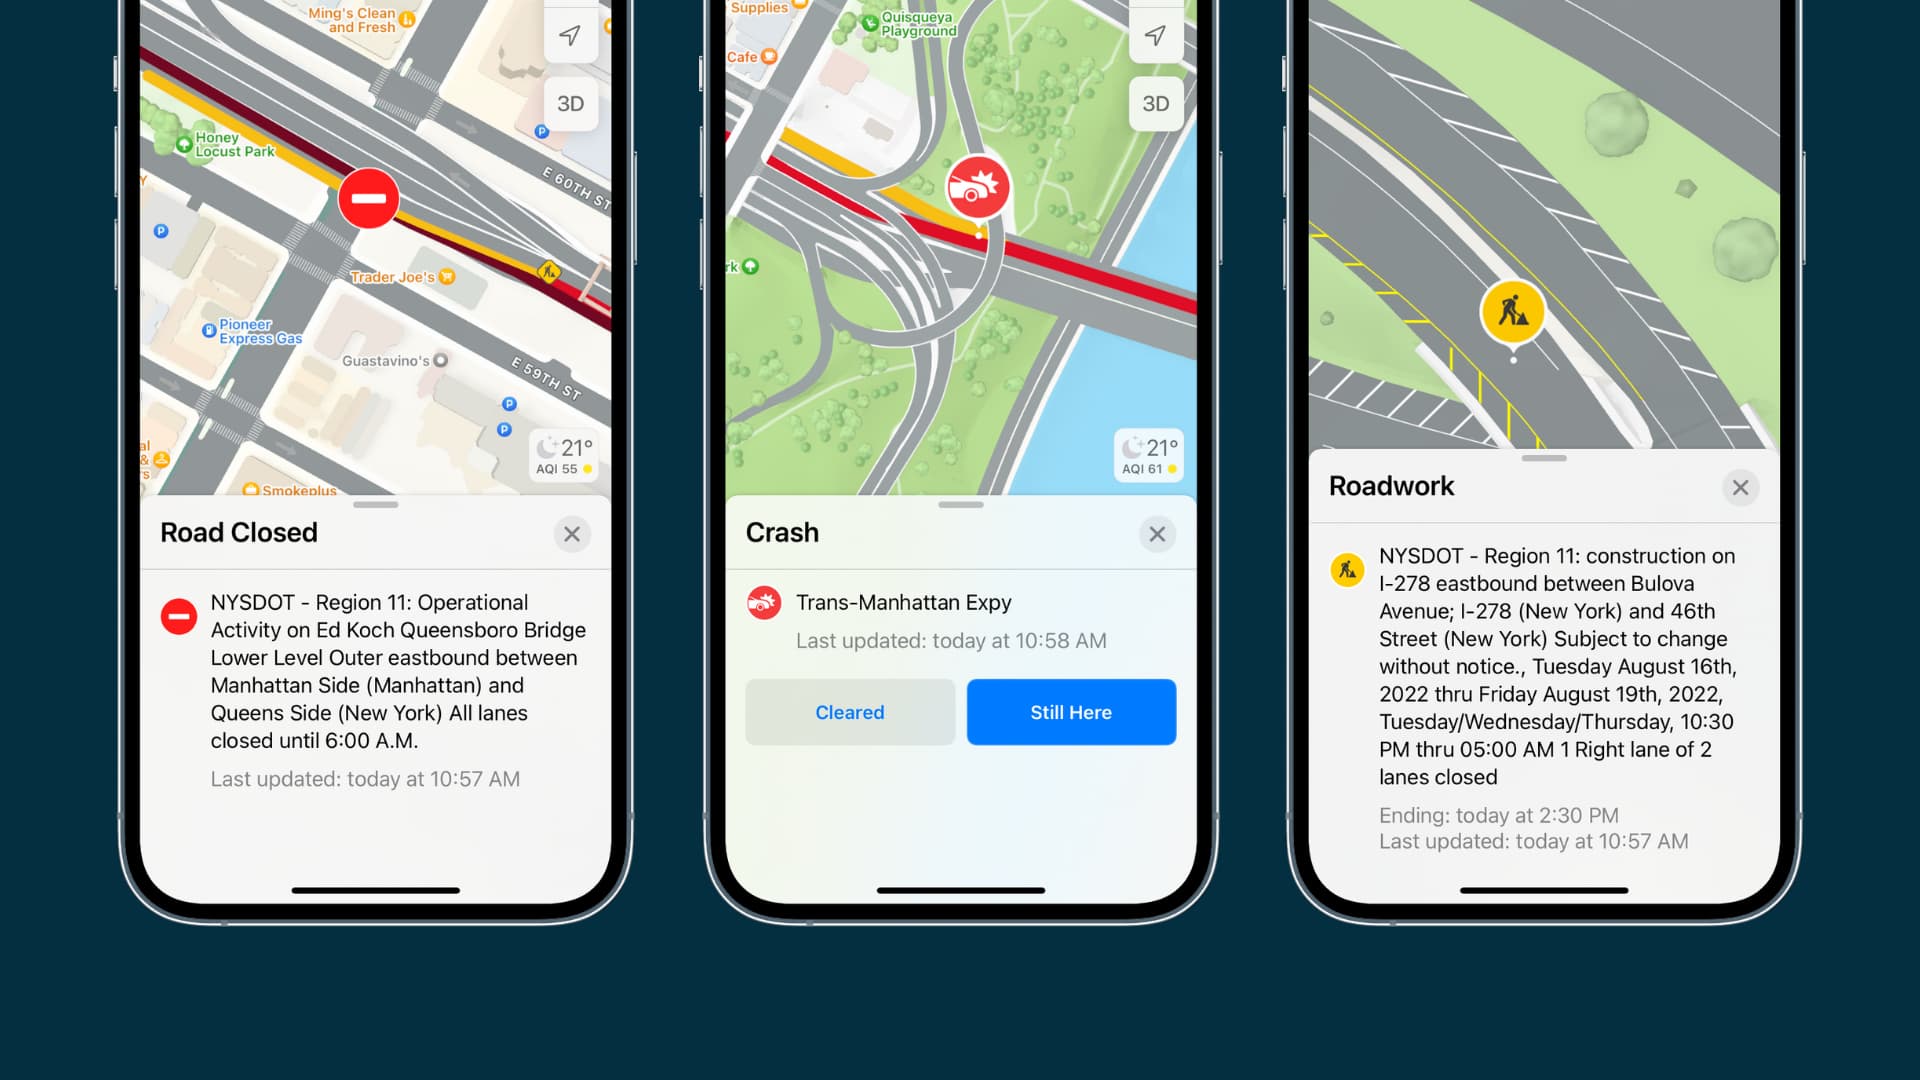
- Dark Red: This typically indicates a severe slowdown, where traffic is moving at a crawl or is completely stopped. Expect significant delays and potential for rerouting if a faster alternative exists.
- Lighter Red/Orange: While not as dire as dark red, these shades still point to congested conditions. You’ll likely experience slower speeds and increased travel times, but traffic might still be moving, albeit at a reduced pace.
The data powering these color indicators is constantly updated. Apple Maps gathers information from a variety of sources, including anonymous data from iPhone users’ devices (with their permission, of course), reports from transit agencies, and sometimes even crowdsourced information from users who report incidents or conditions. This real-time data analysis is a prime example of how Technology is revolutionizing everyday tasks. The ability to process vast amounts of geographical and movement data to predict and display traffic conditions is a testament to advancements in data science, machine learning, and network infrastructure.
The practical application of this feature directly impacts our Productivity. Knowing that a particular route is heavily congested allows us to make informed decisions. We can choose to delay our departure, explore alternative routes that might be less affected, or even opt for public transportation if that offers a more predictable travel time. This proactive approach to navigation saves time, reduces stress, and ultimately enhances our ability to be productive by ensuring we arrive at our destinations on schedule.
Beyond Navigation: Red as a Visual Language in Tech and Branding
The use of red on Apple Maps, while functional, also taps into a broader understanding of how colors are used in Technology and Brand strategy. Red is a color with strong psychological associations, and its deployment in a user interface is rarely accidental.
The Psychology of Red in User Interfaces
Across many digital platforms, red is often used to signify:
- Alerts and Warnings: Think of error messages, critical system notifications, or danger indicators. Red grabs attention immediately and signals that something requires immediate awareness or action.
- Urgency: The color can create a sense of urgency, prompting users to pay attention and react.
- Importance: In some contexts, red can highlight elements of particular importance or priority.
Apple, as a leading Brand, is a master of visual communication. Their design philosophy emphasizes clarity, simplicity, and intuitive interaction. The consistent use of red for traffic congestion aligns perfectly with this philosophy. It’s a universally understood symbol for something that impedes progress and requires attention. This strategic color choice not only enhances the usability of Apple Maps but also reinforces the Apple brand’s reputation for thoughtful and user-centric design.
When considering Corporate Identity and Brand Strategy, the choice of colors is paramount. Brands meticulously select colors that evoke specific emotions and associations. Red, with its connotations of energy, passion, and sometimes caution, is a powerful tool. For Apple, using red to denote traffic issues reinforces the idea that their products and services are designed to help users navigate the complexities of modern life, including the often-frustrating reality of traffic.
Red’s Indirect Influence on Our Financial Lives
While the immediate context of red on Apple Maps is navigational, its underlying principles and broader implications can subtly influence our Money decisions. Understanding how technology uses visual cues to manage our time and resources has a ripple effect.
Time is Money: The Financial Implications of Traffic Delays
The most direct link between red on Apple Maps and personal finance lies in the concept of “time is money.” Every minute spent stuck in traffic is a minute not spent working, earning, or engaging in more productive activities.
- Lost Income: For individuals whose work relies on timely arrivals (e.g., delivery drivers, sales professionals, service technicians), significant traffic delays can directly translate to lost income or reduced earning potential.
- Increased Expenses: Longer travel times often mean higher fuel consumption, contributing to increased personal expenses. If the delay is substantial, it might also necessitate the purchase of coffee, snacks, or other consumables during the extended journey.
- Opportunity Cost: Beyond immediate financial losses, traffic delays represent an opportunity cost. The time spent immobile could have been used for personal development, exercise, family time, or other activities that contribute to overall well-being and potentially long-term financial growth.
By providing real-time traffic information, Apple Maps empowers users to mitigate these financial losses. Choosing an alternative route or delaying a trip can save both time and money, demonstrating how sophisticated Technology tools can contribute to better Personal Finance management.
The Role of Data and AI in Financial Decision-Making
The same data analysis and AI that power Apple Maps’ traffic predictions are increasingly being applied to the financial world. From algorithmic trading to personalized financial advice, the ability to process complex data sets and identify patterns is transforming how we manage our Money.
- Investment Tools: Just as Apple Maps analyzes traffic patterns, financial tools analyze market trends, economic indicators, and individual spending habits to offer investment recommendations or budgeting insights.
- Risk Assessment: Understanding congestion on a road involves assessing risk (delay). Similarly, financial tools assess risk in investments or lending.
- Personalized Services: The trend in both tech and finance is towards personalization. Apple Maps learns your preferred routes and habits; financial apps learn your spending patterns to offer tailored advice.
Therefore, the seemingly simple act of observing red on a map is an indirect connection to the broader technological advancements that are shaping our financial landscapes. It underscores the importance of data literacy and the ability to leverage information to make smarter decisions, whether it’s about navigating a city or managing our investments.
Conclusion: Red on Apple Maps – A Symbol of Efficient Navigation and Data-Driven Insights
The color red on Apple Maps is a clear and concise indicator of traffic congestion. It serves as a vital tool for drivers, helping them make informed decisions to optimize their journeys and avoid delays. This functionality is a prime example of how advanced Technology can enhance our daily lives by providing real-time, actionable information.
However, the meaning of red extends beyond its immediate navigational purpose. It aligns with the broader visual language employed in Tech and Brand strategy, leveraging universally understood symbols to communicate urgency and importance. Apple’s meticulous Design choices, including the use of color, contribute to its strong Corporate Identity and reputation for user-friendly innovation.
Furthermore, the underlying principles of data analysis and efficiency that drive Apple Maps’ traffic system have a subtle yet significant influence on our Money. By helping us save time, reduce expenses, and avoid costly delays, these technological advancements indirectly contribute to better Personal Finance management. In essence, understanding what red means on Apple Maps offers a glimpse into the interconnectedness of technology, brand communication, and our financial well-being in the digital age.
aViewFromTheCave is a participant in the Amazon Services LLC Associates Program, an affiliate advertising program designed to provide a means for sites to earn advertising fees by advertising and linking to Amazon.com. Amazon, the Amazon logo, AmazonSupply, and the AmazonSupply logo are trademarks of Amazon.com, Inc. or its affiliates. As an Amazon Associate we earn affiliate commissions from qualifying purchases.