
The quest to determine the absolute thermal ceiling of our planet is more than a simple exercise in meteorological record-keeping; it is a critical benchmark for climate science, urban planning, and the financial implications of a warming world. As global temperatures fluctuate, understanding the extreme historical data points—the “hottest of the hot”—is essential for investors and analysts assessing risk in the infrastructure, agricultural, and insurance sectors.
The Official Benchmark: Furnace Creek and the 134°F Controversy
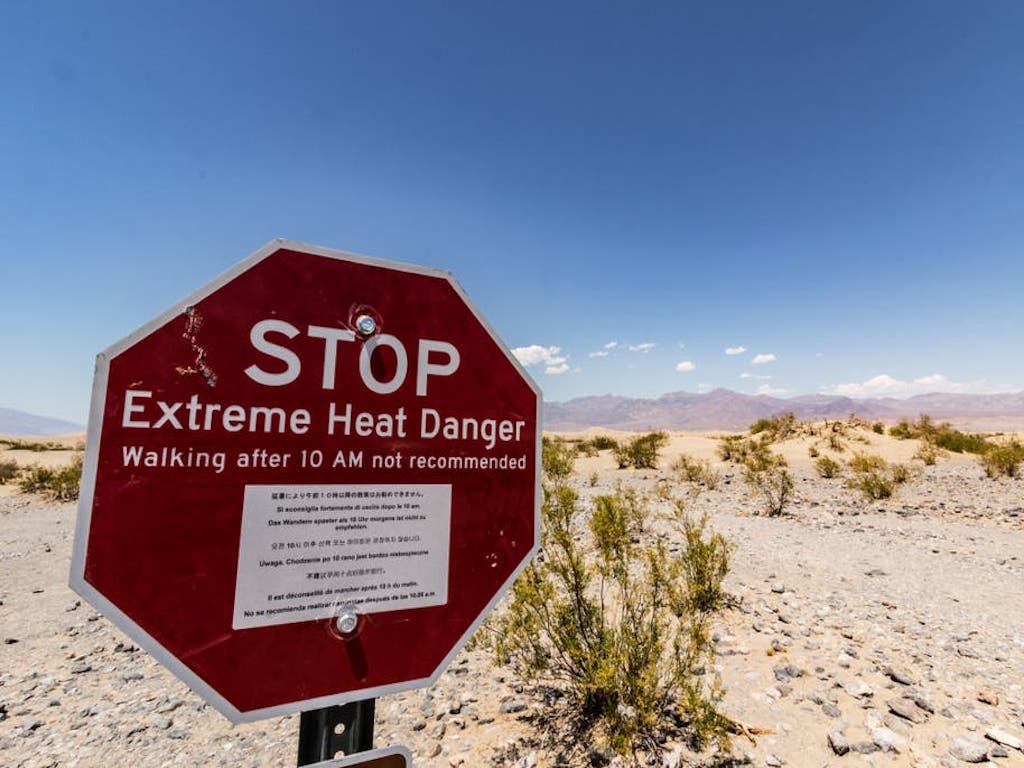
For decades, the standard-bearer for the highest temperature ever recorded on Earth has been Death Valley, California. On July 10, 1913, the Greenland Ranch weather station officially logged a temperature of 134°F (56.7°C). This figure remains the World Meteorological Organization (WMO) verified record, yet it continues to spark rigorous debate within the scientific community.
Analyzing the Historical Data
Meteorologists and climatologists have long scrutinized the 1913 reading. Critics of the record point to the limitations of early 20th-century instrumentation and the potential for observer error. In the context of modern data modeling, the 1913 measurement stands as a statistical outlier that defies the surrounding weather patterns observed in the region at the time. Despite these challenges, the WMO maintains this as the official record, anchoring our understanding of planetary thermal extremes.
Why Verification Matters for Risk Modeling
From an analytical perspective, these records are not merely trivia; they are data points used to calibrate global climate models. When insurance companies and financial institutions calculate the “Value at Risk” (VaR) for real estate or agricultural commodities, they rely on these historical extremes to stress-test their portfolios. If a record is deemed questionable, it can lead to miscalculations in heat-related insurance premiums and long-term asset depreciation forecasts.
Modern Climate Extremes and the Role of Satellite Monitoring
In recent years, the methodology for measuring heat has shifted from localized, ground-based stations to advanced satellite telemetry. This transition has changed how we define “warmest,” as satellite sensors can capture surface temperatures across vast, unpopulated deserts where human-staffed weather stations do not exist.
Surface Temperature vs. Air Temperature
It is vital to distinguish between air temperature—measured five feet above the ground in a shaded, ventilated enclosure—and land surface temperature. Satellites like those operated by NASA and the European Space Agency measure the heat radiating from the Earth’s surface. In places like the Lut Desert in Iran, satellite readings have recorded surface temperatures exceeding 159°F (70.7°C).
Implications for Financial Asset Allocation
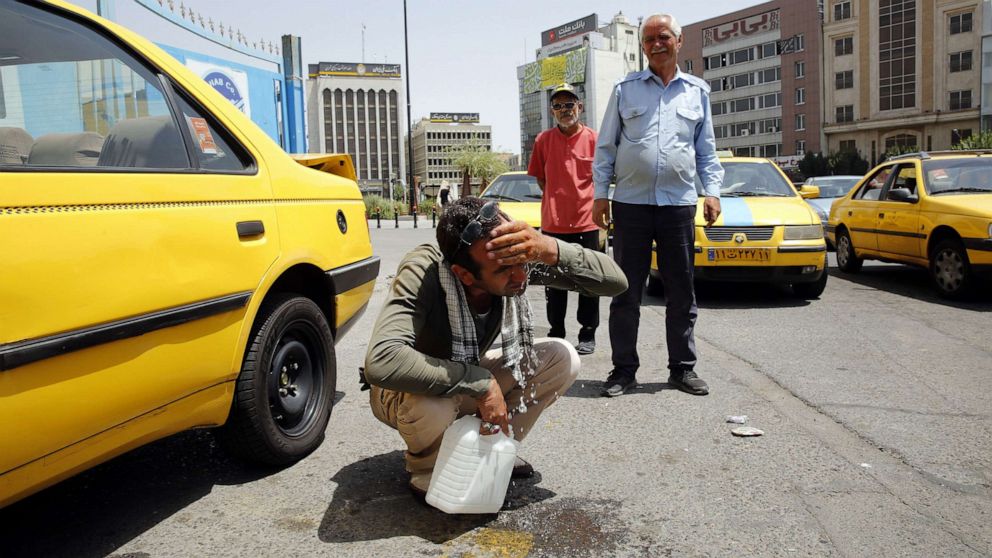
The disparity between air and surface temperature is significant for infrastructure investment. Roads, runways, and power grids are physically impacted by the heat of the surface itself. For investors focusing on “hard” assets, understanding these extreme surface readings is a necessity for determining the durability and life cycle of materials. High-heat environments accelerate the degradation of asphalt, weaken structural integrity in metal-based construction, and reduce the efficiency of electrical transmission lines—all of which are vital considerations for institutional infrastructure funds.
Economic Impacts of Thermal Extremes
As global temperatures continue to rise, the economic “cost of heat” is becoming a primary focus for portfolio managers and corporate strategists. A record-breaking temperature is often a leading indicator of broader economic disruption, ranging from labor productivity declines to energy grid instability.
Labor Productivity and Business Continuity
The financial sector tracks heat waves as a direct drag on GDP. When temperatures approach the records discussed above, productivity in sectors like construction, shipping, and outdoor retail plummets. Human physiological limits dictate that sustained work in extreme heat results in slower output, higher error rates, and increased healthcare costs. Companies with large manual labor workforces in arid or tropical climates are now integrating heat-risk assessments into their annual ESG (Environmental, Social, and Governance) reports to appease shareholders concerned with long-term operational resilience.
Energy Grid Volatility and “Heat Hedging”
Extreme heat drives an exponential increase in cooling demand. In financial markets, this creates volatility in energy prices. When temperatures hit record highs, the strain on the power grid can lead to blackouts or forced load shedding, disrupting manufacturing and tech operations. Financial institutions have begun utilizing “temperature-based derivatives”—a type of financial instrument that allows businesses to hedge against the economic consequences of unseasonably hot weather. By betting on or against specific temperature thresholds, firms can offset the increased costs of energy usage or the lost revenue associated with business interruptions.
The Future of Climate Finance and Data Accuracy
Looking forward, the integration of big data and AI-driven predictive modeling is changing how we evaluate the “warmest temperature on Earth.” We are moving toward a future where historical records serve as a foundation for predictive analytics rather than just archival data.
Predictive Modeling and Portfolio Strategy
Investors are increasingly using proprietary climate risk models that simulate the likelihood of future temperature extremes. By combining the historical data from the 1913 Death Valley record with modern, high-resolution climatic trends, analysts can project the likelihood of “heat-stress events” occurring in specific geographical regions over the next thirty years. This allows for more sophisticated capital allocation, steering investments toward regions with greater climate stability and away from areas projected to become essentially uninhabitable due to sustained extreme heat.

The Role of Transparency in Climate Data
For the financial markets to function efficiently, the data underlying climate risk must be transparent and standardized. The ongoing refinement of how we define and measure the “hottest temperature” is part of a larger push toward transparency in climate science. As international regulatory bodies demand better disclosure of climate-related financial risks, the precision of these records becomes a pillar of financial stability. Ensuring that data is rigorously verified prevents “greenwashing”—where companies might downplay or exaggerate climate risks to influence stock prices—and fosters a marketplace built on reliable, peer-reviewed scientific data.
Ultimately, while the search for the absolute hottest spot on Earth continues, the real value lies in how that data is synthesized into the global economy. Whether it is through the adjustment of infrastructure design, the pricing of insurance premiums, or the strategic hedging of energy portfolios, the world’s temperature extremes remain a fundamental, if sometimes volatile, factor in modern financial planning. As we continue to refine our measurement tools and expand our data sets, the ability to translate these meteorological phenomena into actionable financial intelligence will remain a core competency for those navigating the intersection of climate and capital.
aViewFromTheCave is a participant in the Amazon Services LLC Associates Program, an affiliate advertising program designed to provide a means for sites to earn advertising fees by advertising and linking to Amazon.com. Amazon, the Amazon logo, AmazonSupply, and the AmazonSupply logo are trademarks of Amazon.com, Inc. or its affiliates. As an Amazon Associate we earn affiliate commissions from qualifying purchases.