The financial world often speaks in a language that can seem esoteric to the uninitiated, and few terms generate as much confusion, or indeed, fascination, as “stock market points.” Daily news cycles trumpet headlines like “Dow gains 300 points” or “S&P 500 drops 50 points,” leaving many to wonder: what exactly are these “points,” and why do they matter? Are they a measure of wealth, a currency, or simply an abstract unit? Understanding stock market points is not merely an exercise in financial literacy; it’s a fundamental step toward comprehending the pulse of the economy, deciphering market sentiment, and making more informed investment decisions. Far from being an arcane concept, points are a crucial metric that provides a snapshot of the market’s health and direction, influencing everything from investor confidence to broader economic policy.
This article will demystify stock market points, explaining their true nature, their significance in interpreting market movements, and how different indices utilize them. By the end, you will possess a clearer understanding of what these points represent, how they are calculated, and, most importantly, how to interpret them intelligently within the broader context of your financial journey.
Demystifying Stock Market Points: The Basics
At its core, a “stock market point” is a unit of measure used to express the change in value of a stock market index. It is not a currency, nor does it directly translate to a specific dollar amount in the same way an individual stock price does. Instead, points are a conventional way of quantifying the collective movement of a basket of stocks that comprise an index, providing a simplified metric for tracking overall market performance.
What “Points” Truly Represent
When you hear that an index like the Dow Jones Industrial Average (DJIA) gained 100 points, it doesn’t mean every stock in the index went up by 100 dollars, or even 100 cents. Rather, it signifies a calculated change in the aggregate value of the stocks within that particular index. These points are essentially a way of measuring the magnitude of change, similar to how temperature is measured in degrees. The true significance of a point movement often lies in its relationship to the index’s current level. For example, a 100-point gain on an index valued at 1,000 points (a 10% increase) is far more impactful than a 100-point gain on an index at 30,000 points (a 0.33% increase). Therefore, while absolute point changes grab headlines, percentage change offers a more accurate and contextual understanding of market shifts.
Indices vs. Individual Stocks
It’s critical to distinguish between the movement of market indices and the prices of individual stocks. Individual stocks trade in dollars and cents, and their price changes are explicit monetary values. If Apple stock goes up by $1.50, that’s a direct price increase. Stock market points, however, apply almost exclusively to market indices. An index is a hypothetical portfolio of stocks designed to represent a specific segment of the market or the market as a whole. For instance, the S&P 500 tracks 500 large U.S. companies, while the NASDAQ Composite heavily weights technology stocks. These indices serve as benchmarks, offering a panoramic view of market health without requiring investors to track thousands of individual companies. When we talk about “points,” we are almost always referring to the movement of these aggregated indicators.
How Points Are Calculated (Simply)
The calculation of points varies significantly between different indices, reflecting their underlying methodologies. Broadly, indices are either price-weighted or market-capitalization-weighted.
-
Price-Weighted Indices: The most famous example is the Dow Jones Industrial Average (DJIA). In a price-weighted index, stocks with higher share prices have a greater influence on the index’s point value. The Dow is calculated by summing the prices of its 30 component stocks and dividing by a “Dow Divisor” (which adjusts for stock splits, dividends, and company changes) to maintain historical continuity. A one-dollar change in a higher-priced stock within the Dow will move the index by more points than a one-dollar change in a lower-priced stock.
-
Market-Capitalization-Weighted Indices: The S&P 500 and the NASDAQ Composite are prime examples of this methodology. In these indices, companies with larger market capitalizations (share price multiplied by the number of outstanding shares) have a greater impact on the index’s point value. A 1% change in a large-cap company like Apple or Microsoft will have a more significant effect on the S&P 500’s point total than a 1% change in a smaller-cap company within the index, even if the absolute dollar change in their share price is the same. This method is generally considered to be a more accurate representation of the overall market’s value and movement because it reflects the actual wealth impact on investors.
Understanding these differing calculation methods helps explain why a 100-point move in the Dow might signify a different scale of market activity than a 100-point move in the S&P 500, even if both happen on the same day.
The Significance of Stock Market Point Movements
Beyond the arithmetic, stock market point movements carry substantial weight, acting as a crucial barometer for economic health and investor sentiment. They provide both a daily report card and a long-term trend indicator, influencing perceptions and decisions across the financial landscape.
Gauging Market Sentiment
Point movements are perhaps the most immediate reflection of market sentiment—the collective attitude of investors towards a particular asset or market. Significant gains in points, often termed a “rally,” typically indicate widespread optimism, driven by positive economic news, strong corporate earnings, or favorable policy announcements. Conversely, a sharp drop in points, or a “sell-off,” signals pessimism, fear, or uncertainty, often triggered by economic downturns, geopolitical instability, or disappointing corporate performance. These movements are not just numbers; they encapsulate the hope, anxiety, and confidence that drive market participants. Monitoring these point shifts helps investors gauge the prevailing mood, which can be critical for understanding short-term volatility and managing emotional responses to market fluctuations.
Impact on Investor Psychology
The daily drumbeat of stock market points profoundly impacts investor psychology. Large upward swings can foster euphoria and a “fear of missing out” (FOMO), potentially leading to impulsive buying. Conversely, substantial point declines can induce panic and fear, often prompting investors to sell assets at a loss, even if their long-term strategy dictates holding. This psychological aspect underscores the importance of a disciplined, long-term approach to investing, rather than reacting viscerally to daily point changes. Savvy investors understand that market points are a metric to be analyzed, not an emotional trigger to be obeyed. They differentiate between market noise and genuine shifts in economic fundamentals.
Economic Barometer
Stock market points also serve as a leading economic indicator. While the market isn’t the economy, there’s a strong correlation between sustained market performance and broader economic health. A consistently rising market, reflected in steadily increasing point totals, often foreshadows periods of economic growth, job creation, and corporate prosperity. Conversely, prolonged declines can signal an impending recession or economic slowdown. This is because the stock market is forward-looking; investors constantly price in their expectations for future corporate earnings and economic conditions. Therefore, changes in stock market points can provide an early warning system, prompting policymakers, businesses, and individuals to adjust their strategies in anticipation of future economic shifts.
Different Indices, Different Points: A Comparative Look
While the concept of points remains consistent—a unit of change—its interpretation is deeply intertwined with the specific index being discussed. Each major index tracks a different segment of the market or uses a distinct methodology, leading to varying point scales and implications.
The Dow Jones Industrial Average (DJIA)
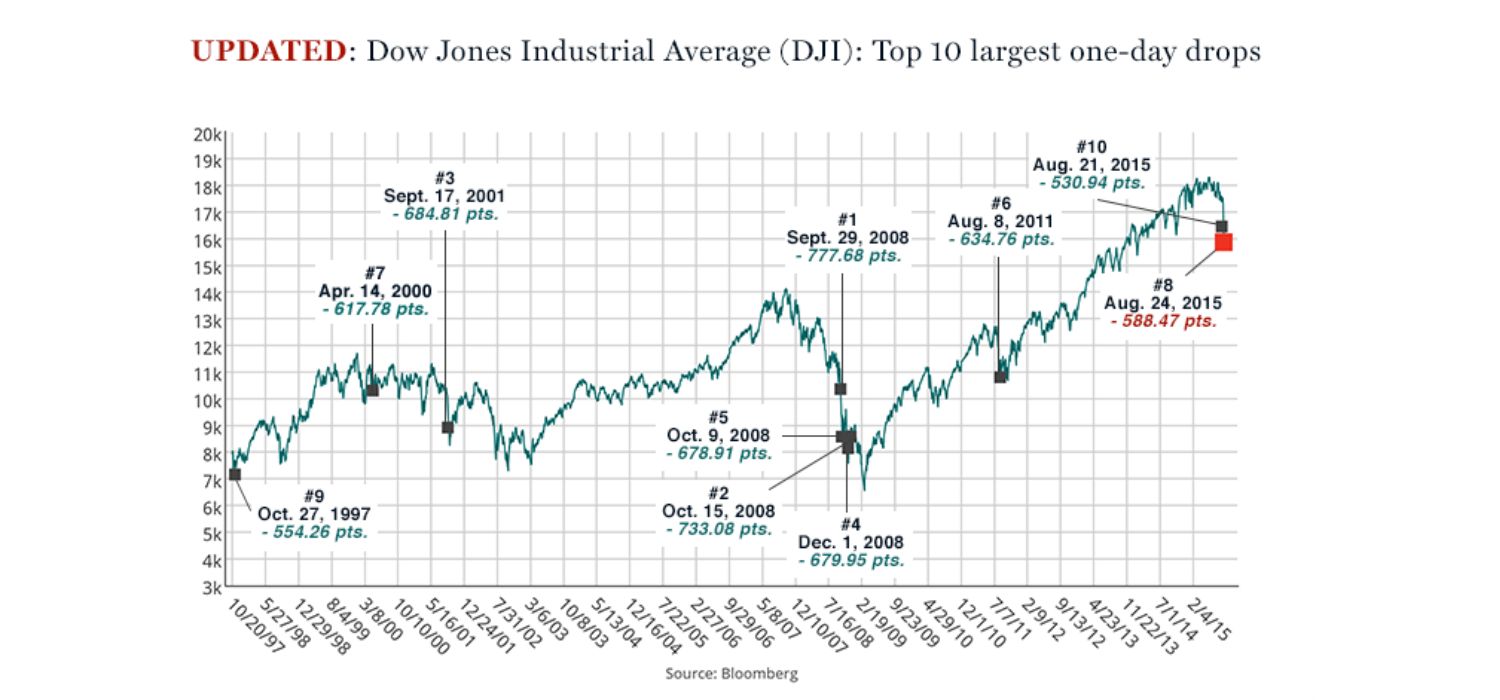
The DJIA, often simply called “the Dow,” is perhaps the most famous and oldest stock market index. It tracks 30 large, publicly traded companies in the United States, representing various sectors excluding transportation and utilities. Because it is a price-weighted index, a one-dollar change in a high-priced Dow component has a larger impact on the index’s point total than the same dollar change in a lower-priced component. Its point movements are widely reported and often used as a quick summary of the overall market’s direction. However, due to its limited number of components and price-weighted nature, the Dow is sometimes criticized for not being a fully representative barometer of the broader U.S. economy, despite its historical prominence.
The S&P 500
The S&P 500 is generally considered a much broader and more accurate representation of the U.S. stock market than the Dow. It comprises 500 large-cap U.S. companies, selected by S&P Dow Jones Indices based on criteria like market size, liquidity, and sector representation. Crucially, the S&P 500 is a market-capitalization-weighted index. This means that companies with larger market values (like Apple, Microsoft, Amazon, Google) have a greater influence on the index’s point movements. A 1% change in Apple’s stock price will move the S&P 500 by more points than a 1% change in a smaller company within the index. Its wider scope and market-cap weighting make its point movements a more reliable indicator of overall market health and investor wealth.
The NASDAQ Composite
The NASDAQ Composite index is another major U.S. market benchmark, known for its heavy weighting towards technology and growth companies. It includes nearly all stocks listed on the NASDAQ stock exchange, which is home to many prominent tech giants. Like the S&P 500, it is a market-capitalization-weighted index. Due to its concentration in often-volatile technology and innovation sectors, the NASDAQ Composite tends to exhibit greater point volatility compared to the S&P 500 or the Dow. Its point movements are keenly watched by investors interested in the tech sector and can be a strong indicator of sentiment toward growth stocks and innovation.
Interpreting Point Changes: Beyond the Headlines
While daily point totals offer a snapshot, true insight comes from understanding the context, differentiating between noise and trend, and identifying the underlying factors driving market movements.
The Importance of Context
The raw number of points gained or lost can be misleading without context. A 100-point move in the Dow when it was at 10,000 points represented a 1% change, which is significant. The same 100-point move when the Dow is at 35,000 points is only about a 0.28% change, a much smaller relative shift. Therefore, it’s far more informative to look at percentage changes rather than just absolute point changes. Percentage changes normalize the data, allowing for meaningful comparisons across different periods and indices, regardless of their absolute value. Furthermore, comparing current point movements to historical averages and volatility levels provides a clearer picture of whether the day’s activity is truly exceptional or merely part of typical market fluctuations.
Short-Term Volatility vs. Long-Term Trends
The stock market is inherently volatile in the short term, with daily point fluctuations driven by a multitude of factors, some rational, some emotional. These daily ups and downs are often characterized as “market noise.” For long-term investors, focusing excessively on these short-term point movements can be counterproductive, leading to impulsive decisions. What truly matters for building wealth are the long-term trends—sustained upward or downward movements over months or years. A 100-point drop one day might be entirely recovered, or even surpassed, the next. A disciplined investor focuses on their financial goals, asset allocation, and fundamental analysis, rather than getting swayed by every market point swing.
Factors Influencing Point Movements
Stock market points don’t move in a vacuum. Their fluctuations are a direct consequence of a complex interplay of various factors:
- Economic Data: Reports on inflation, interest rates, GDP growth, employment figures, and consumer confidence can significantly impact market points. Positive data often leads to gains, while negative data can trigger declines.
- Corporate Earnings: Company-specific and aggregate corporate earnings reports are critical. Strong earnings beat expectations, boosting confidence and driving up points. Missed expectations or weak outlooks can have the opposite effect.
- Geopolitical Events: Wars, trade disputes, political instability, and major international events can introduce uncertainty and trigger broad market reactions, leading to significant point swings.
- Central Bank Policies: Decisions by central banks (like the Federal Reserve in the U.S.) regarding interest rates, quantitative easing, and other monetary policies have a profound influence on borrowing costs, corporate profitability, and investor sentiment, thus moving market points.
- Technological Advancements/Disruptions: Especially impactful for tech-heavy indices like the NASDAQ, new innovations or disruptive technologies can shift market dynamics and investor enthusiasm.
Strategic Implications for Investors
Understanding stock market points is not just academic; it has practical strategic implications for how investors approach their portfolios and navigate the financial markets.
Informed Decision-Making
A clear grasp of what stock market points represent empowers investors to make more rational, informed decisions. Instead of reacting emotionally to dramatic headlines about point losses, an investor who understands the underlying mechanics and context can assess whether a particular market movement truly signals a fundamental shift or is simply short-term noise. This discernment helps in avoiding panic selling during downturns or speculative buying during rallies, allowing for adherence to a well-thought-out investment strategy. Informed decision-making means evaluating the percentage change, the underlying economic factors, and the long-term outlook, rather than just the absolute point total.
Diversification and Risk Management
The volatility reflected in stock market points underscores the perennial importance of diversification and robust risk management. Even if major indices are showing strong gains, individual sectors or stocks might be underperforming. Conversely, a broad market decline doesn’t necessarily mean every asset class is struggling. A diversified portfolio, spread across various asset classes (stocks, bonds, real estate), sectors, and geographies, helps mitigate the impact of adverse point movements in any single market segment. Understanding point movements, particularly across different indices, can help investors assess their portfolio’s overall exposure to different market risks and adjust their asset allocation accordingly.
Long-Term Perspective Remains Key
Ultimately, the most crucial takeaway for investors regarding stock market points is the imperative of maintaining a long-term perspective. While daily point totals offer a fascinating glimpse into the market’s immediate reactions, they are rarely determinative of an investor’s long-term financial success. Historical data consistently demonstrates that markets tend to trend upwards over extended periods, despite numerous corrections and downturns along the way. Investors focused on achieving financial goals like retirement, education savings, or wealth accumulation should prioritize consistent contributions, thoughtful asset allocation, and periodic rebalancing, rather than attempting to time the market based on daily point fluctuations. The power of compounding over time, coupled with a disciplined approach, far outweighs the perceived benefits of reacting to short-term market noise.

Conclusion
Stock market points, often sensationalized in financial news, are fundamentally units of measure that quantify the movement of market indices. They are not currency but a crucial metric reflecting changes in the collective value of a basket of stocks. From the price-weighted Dow to the market-capitalization-weighted S&P 500 and NASDAQ, each index uses points to distill complex market activity into an understandable indicator.
Beyond mere numbers, these points act as a real-time barometer of economic health and investor sentiment, influencing psychological responses and offering insights into broader financial trends. However, their true significance is unlocked by understanding the context—prioritizing percentage change over absolute numbers, distinguishing between short-term volatility and long-term trends, and recognizing the myriad factors that drive their fluctuations.
For investors, a clear understanding of stock market points translates into more informed decision-making, emphasizing diversification, risk management, and, above all, the unwavering commitment to a long-term investment strategy. While the daily dance of points will continue to capture headlines, the astute investor recognizes them as guideposts rather than absolute directives, maintaining focus on their overarching financial goals through the inevitable ebbs and flows of the market. In the dynamic world of finance, knowledge of “what are stock market points” is not just an advantage; it’s an essential component of financial wisdom.
aViewFromTheCave is a participant in the Amazon Services LLC Associates Program, an affiliate advertising program designed to provide a means for sites to earn advertising fees by advertising and linking to Amazon.com. Amazon, the Amazon logo, AmazonSupply, and the AmazonSupply logo are trademarks of Amazon.com, Inc. or its affiliates. As an Amazon Associate we earn affiliate commissions from qualifying purchases.