The daily movements of the stock market are a constant source of fascination, anxiety, and opportunity for millions worldwide. Each morning, investors, analysts, and casual observers alike eagerly check the opening bell, and by the close, the burning question often becomes: “How much was the stock market down today?” This seemingly simple query unlocks a complex web of economic indicators, corporate performance, geopolitical events, and investor sentiment that collectively dictate the financial health of nations. Understanding the context behind a daily dip, rather than simply reacting to the headline number, is crucial for anyone engaging with the world of finance and investing.
A down day in the market can range from a minor correction, a natural ebb in the larger flow, to a more significant plunge signaling underlying systemic concerns. It’s a snapshot, a single frame in a much longer movie, but one that can significantly influence short-term perceptions and, if misunderstood, lead to rash decisions. This article will delve into the mechanisms behind daily market declines, explore the key indices that serve as our financial barometers, dissect the myriad factors that can trigger a downturn, and, most importantly, provide a framework for interpreting these movements and navigating market volatility with a strategic mindset.
Understanding Daily Market Movements
The stock market is a dynamic ecosystem, a continuous auction where millions of shares are bought and sold every second. Its daily fluctuations are the aggregate result of countless individual decisions made by investors reacting to new information, anticipating future events, and adjusting their portfolios. A “down day” simply means that, on balance, the collective value of stocks (or a specific index of stocks) decreased from its opening price to its closing price.
The Rhythmic Pulse of Global Markets
Financial markets never truly sleep. While the major exchanges in New York (NYSE and Nasdaq) operate during specific hours, global markets are always open somewhere. News breaking in Asia overnight can influence European markets, which then set the tone for the US open. This interconnectedness means that today’s decline might not be an isolated event but rather a ripple effect from earlier developments or an anticipation of upcoming data releases. The speed at which information travels in the digital age amplifies this interconnectedness, causing rapid and often dramatic shifts in investor sentiment.
Not All Declines Are Equal
A 1% drop on the Dow Jones Industrial Average might seem significant, but its implications differ vastly from a 10% flash crash. The former is often part of normal market oscillations, while the latter could signal panic or a major unforeseen event. It’s also important to distinguish between a broad market decline, where almost all sectors are down, versus a sector-specific downturn, where, for instance, technology stocks might be falling while energy stocks remain robust. Understanding this nuance is the first step in moving beyond the headline figure. A broad decline might point to macroeconomic concerns, while a sector-specific dip could indicate industry-specific challenges or a rotation of capital to other areas perceived as having better growth prospects.
Key Indices: The Barometers of Market Health
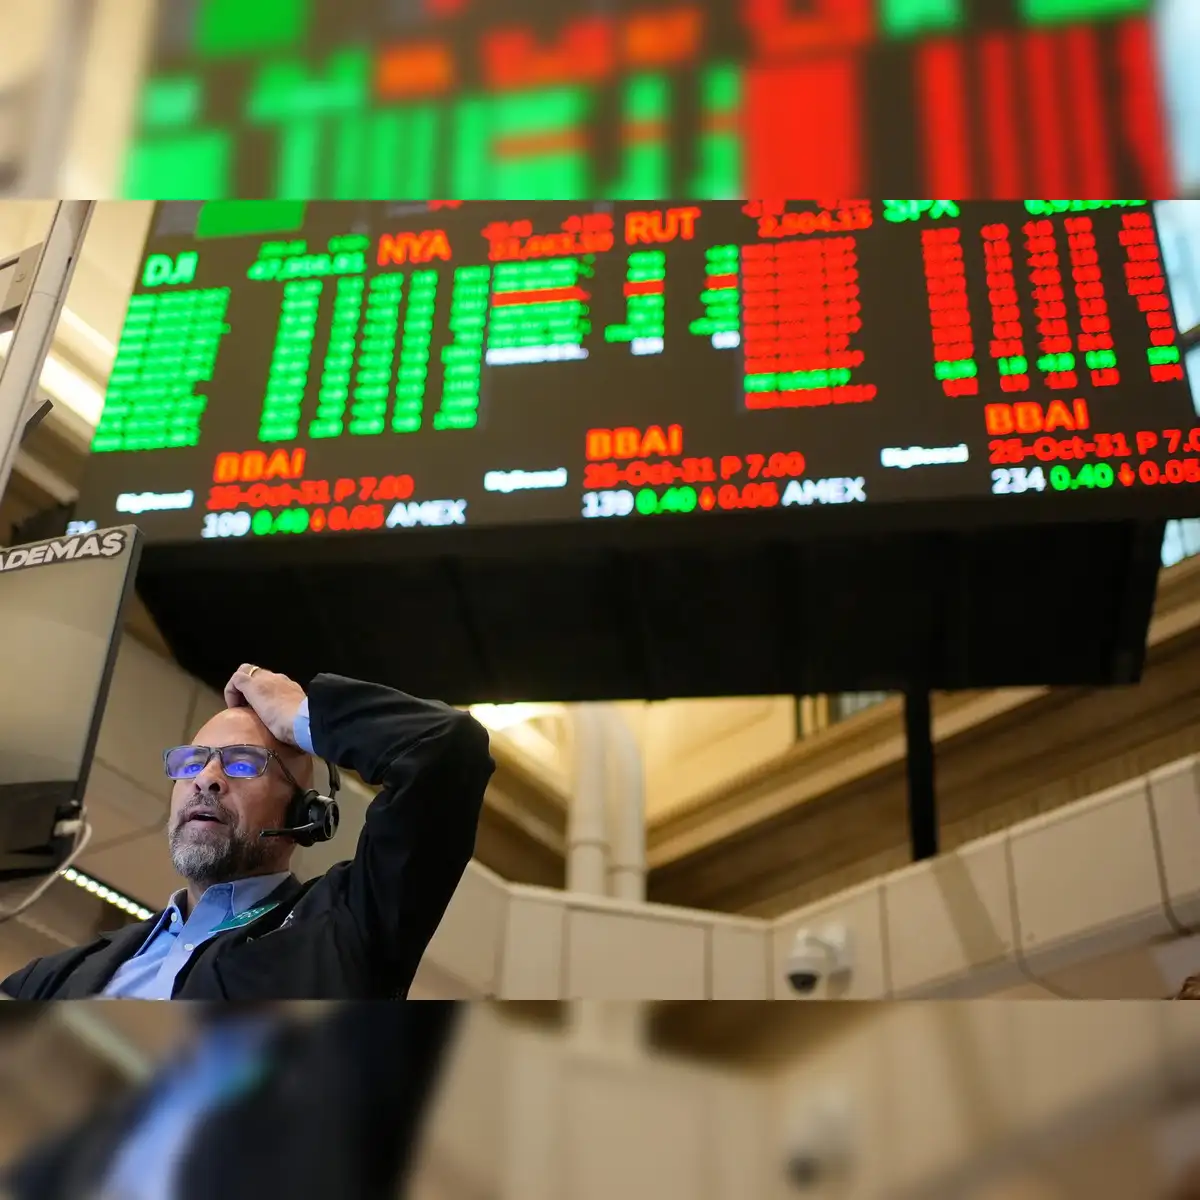
When we ask “how much was the stock market down today,” we are typically referring to the performance of one or more major stock market indices. These indices are curated baskets of stocks designed to represent a specific segment of the market or the market as a whole. Their daily movements are widely reported and serve as the most accessible gauge of market health.
The Dow Jones Industrial Average (DJIA)
Often simply called “the Dow,” this index comprises 30 large, publicly owned companies based in the United States. It’s price-weighted, meaning stocks with higher share prices have a greater impact on the index’s value. While historically significant, its limited number of components means it doesn’t represent the entire breadth of the U.S. economy, but it offers a snapshot of established industrial giants.
The S&P 500: A Broader Snapshot
The S&P 500 is considered a much broader and more representative measure of the U.S. stock market’s health. It includes 500 of the largest U.S. companies across various sectors, weighted by market capitalization (the total value of a company’s outstanding shares). Because of its diversification and market-cap weighting, professional investors often consider the S&P 500 the best single gauge of large-cap U.S. equities.
The Nasdaq Composite: A Tech-Heavy Gauge
The Nasdaq Composite Index includes nearly all stocks listed on the Nasdaq stock exchange, which is known for listing technology and growth-oriented companies. Its performance is often seen as a bellwether for the tech sector, and significant movements in the Nasdaq can indicate shifts in investor appetite for innovation and high-growth potential.
Global Market Perspective: Beyond the US
While U.S. indices are frequently cited, it’s crucial to remember that global markets are interconnected. Indices like the FTSE 100 (UK), DAX (Germany), Nikkei 225 (Japan), and Shanghai Composite (China) provide insights into the health of other major economies. A significant downturn in one major global market can trigger a chain reaction across others, underscoring the importance of a global perspective for comprehensive market analysis.
What Triggers a Daily Market Downturn?
The causes of a stock market decline are rarely singular; more often, it’s a confluence of factors creating a domino effect. Identifying these triggers helps in understanding the severity and potential longevity of a downturn.
Economic Indicators and Data Releases
Governments and private institutions regularly release economic data points, such as inflation rates, employment figures, GDP growth, retail sales, and manufacturing output. Disappointing reports, especially those signaling slowing growth or rising inflation, can prompt investors to re-evaluate future corporate earnings and economic stability, leading to sell-offs. For example, higher-than-expected inflation can signal a decrease in consumer purchasing power and higher input costs for businesses, dampening profit outlooks.
Corporate Earnings and Outlook
Individual company performance significantly impacts market sentiment. When major companies report weaker-than-expected earnings, provide cautious guidance for future quarters, or announce negative developments (e.g., product recalls, lawsuits), their stock prices can fall, dragging down relevant indices, especially if they are large-cap components. A wave of negative earnings reports across a sector or the broader market can trigger a substantial downturn.
Geopolitical Events and Uncertainty

Global stability is a cornerstone of investor confidence. Geopolitical tensions, conflicts, political instability in key regions, trade disputes, or even major international policy changes can introduce significant uncertainty into the market. Investors often react by seeking safer assets, like government bonds, or by reducing their equity exposure, leading to market declines. The unpredictability of these events makes them particularly potent market movers.
Interest Rate Expectations and Central Bank Policy
Central banks, like the U.S. Federal Reserve, wield immense influence over financial markets primarily through interest rate policy. When central banks signal or implement interest rate hikes, it can make borrowing more expensive for companies and consumers, potentially slowing economic growth. Higher rates also make fixed-income investments more attractive relative to stocks, prompting a shift in capital. Conversely, unexpectedly dovish (accommodative) policy can also cause concern if it signals that the central bank perceives economic weakness requiring stimulus.
Market Sentiment and Technical Factors
Beyond fundamental economic and corporate data, market psychology plays a crucial role. Fear, greed, and herd mentality can amplify movements. A wave of selling by a few large institutional investors can trigger a broader sell-off as others follow suit, fearing they might miss out on preserving capital. Technical analysis, which studies past market data, such as price and volume, can also highlight patterns that contribute to selling pressure, such as a major index falling below a key support level. Algorithmic trading, which executes trades based on complex mathematical models, can also exacerbate market moves in either direction.
Interpreting a Down Day: Beyond the Headlines
Simply knowing “how much” the market was down is insufficient. The true value lies in interpreting that information within a broader financial context.
The Importance of Context and Perspective
A single down day, even a significant one, does not define an entire market cycle. Stock markets are inherently volatile; declines are a normal, albeit uncomfortable, part of investing. Historically, markets have always recovered from downturns, eventually reaching new highs. Focusing too narrowly on daily fluctuations can lead to short-sighted decisions and prevent investors from benefiting from long-term growth. It’s crucial to view daily movements through the lens of one’s long-term financial goals and investment horizon.
Differentiating Corrections from Bear Markets
A “correction” is typically defined as a market decline of 10% or more from its most recent peak. These are relatively common and can be healthy, helping to reset valuations and prevent overheating. A “bear market,” on the other hand, is a more severe and prolonged downturn, usually defined as a drop of 20% or more. Bear markets often coincide with recessions or significant economic distress and can last for several months or even years. Understanding this distinction helps investors gauge the potential severity and duration of a market downturn.
Sector-Specific vs. Broad Market Declines
As mentioned, identifying whether the decline is widespread or concentrated in specific sectors is key. A broad market decline suggests systemic issues impacting the entire economy, whereas sector-specific declines might be due to industry-specific challenges (e.g., regulatory changes, technological disruption, shifts in consumer preferences). This differentiation can inform portfolio adjustments, perhaps suggesting a rotation away from a struggling sector rather than a complete overhaul of one’s entire investment strategy.
Strategic Responses to Market Volatility
For investors, a down day in the stock market shouldn’t necessarily be a call to panic but rather an invitation to review and potentially refine their investment strategy.
Avoid Panic Selling: The Power of Long-Term Investing
One of the most detrimental reactions to a market downturn is panic selling. Selling off investments during a decline locks in losses and ensures you miss out on the subsequent recovery. Historical data consistently shows that long-term investors who stay invested through market corrections and bear markets tend to outperform those who try to time the market. The fundamental principle of investing is to buy low and sell high; selling low reverses this strategy.
Rebalancing Your Portfolio
A market downturn can throw your portfolio’s asset allocation out of whack. If stocks have fallen significantly, your equity exposure might be lower than your target, while bonds might represent a larger proportion. A down day (or period) can be an opportune time to rebalance your portfolio, selling off some assets that have performed well (or are overrepresented) and buying more of those that have declined, thus aligning your holdings with your desired risk profile and strategic allocation.
Dollar-Cost Averaging: Turning Declines into Opportunities
Dollar-cost averaging involves investing a fixed amount of money at regular intervals, regardless of market conditions. When prices are high, your fixed amount buys fewer shares; when prices are low (during a downturn), it buys more shares. This strategy reduces the average cost per share over time and removes the emotion of trying to time the market. A down day, therefore, becomes an opportunity to acquire more shares at a lower price.
Diversification: Your Shield Against Concentration Risk
A well-diversified portfolio across different asset classes (stocks, bonds, real estate), geographies, and sectors is crucial in mitigating the impact of market downturns. While diversification doesn’t guarantee profits or protect against losses, it can smooth out returns by ensuring that not all your investments are exposed to the same risks. If one sector or country is struggling, others might be performing well, offsetting some of the losses.

Consulting a Financial Advisor
For those feeling overwhelmed by market volatility, a qualified financial advisor can provide personalized guidance. An advisor can help assess your risk tolerance, define your financial goals, craft a suitable investment strategy, and provide a calm, rational perspective during tumultuous times. They can explain the nuances of a down day in the context of your specific situation and help you make informed decisions that align with your long-term objectives.
In conclusion, “how much was the stock market down today” is a question that opens the door to deeper financial understanding. While daily declines can be concerning, they are an inherent part of market cycles. By understanding the underlying drivers, utilizing key financial indices, and adopting a disciplined, long-term investment approach, investors can navigate market volatility with confidence, turning potential moments of anxiety into opportunities for strategic growth.
aViewFromTheCave is a participant in the Amazon Services LLC Associates Program, an affiliate advertising program designed to provide a means for sites to earn advertising fees by advertising and linking to Amazon.com. Amazon, the Amazon logo, AmazonSupply, and the AmazonSupply logo are trademarks of Amazon.com, Inc. or its affiliates. As an Amazon Associate we earn affiliate commissions from qualifying purchases.