
The daily closing performance of the Dow Jones Industrial Average (DJIA) is often the headline that captures the immediate attention of investors, analysts, and the general public alike. More than just a simple numerical update, the Dow’s close offers a snapshot of market sentiment, an indicator of the day’s economic currents, and a potential signpost for future trends. Understanding what the Dow Jones is, how to interpret its movements, and the myriad factors influencing its daily trajectory is fundamental for anyone engaging with the financial markets, from seasoned investors to curious observers.
The Dow Jones Industrial Average: A Bellwether of the Market
Often referenced interchangeably with “the market” in casual conversation, the Dow Jones Industrial Average holds a unique place in financial history and analysis. Its daily close is a critical data point, reflecting the collective performance of some of the largest and most influential companies in the United States.

What is the DJIA?
The Dow Jones Industrial Average is a stock market index that measures the stock performance of 30 large companies listed on stock exchanges in the United States. Founded in 1896 by Charles Dow and Edward Jones, it is one of the oldest, best-known, and most frequently cited market indices globally. While its initial intent was to gauge the health of the industrial sector, its composition has evolved significantly over time to include companies from various sectors, reflecting the broader economic landscape. Despite its historical significance, it’s crucial to remember that the DJIA is just one index among many, and its focus on only 30 companies means it doesn’t represent the entire market. However, due to the size and influence of its constituent companies, its movements are often seen as a significant barometer for the overall U.S. economy and corporate health.
Composition and Calculation
Unlike market-capitalization-weighted indices such as the S&P 500, the DJIA is a price-weighted index. This means that stocks with higher share prices have a greater impact on the index’s value than those with lower share prices, regardless of their company’s overall market capitalization. This unique weighting methodology is a historical remnant but means that a significant price movement in a high-priced Dow component will exert a more substantial influence on the index’s daily change compared to a similar percentage move in a lower-priced stock within the index. The index’s components are periodically reviewed and adjusted by a committee to ensure it remains relevant and representative of the evolving U.S. economic structure, though changes are infrequent.
Its Role in the Financial Landscape
The DJIA serves multiple purposes in the financial world. For many, it’s a quick and accessible indicator of market direction. A rising Dow typically signals investor confidence and economic optimism, while a falling Dow can suggest apprehension or economic headwinds. It’s used by analysts to track sector performance, by economists to gauge economic health, and by individual investors as a benchmark for their portfolios. Its visibility also means it often frames the narrative around daily financial news, influencing public perception and potentially even consumer confidence.
Decoding the Day’s Performance: More Than Just a Number
When the news reports “the Dow closed up 100 points” or “down 250 points,” it’s not merely a numerical change. This daily fluctuation is packed with information, reflecting a complex interplay of forces that shaped trading throughout the day.
The Significance of the Closing Price
The closing price of the DJIA, or any financial instrument, is particularly significant because it represents the final agreed-upon valuation at the end of the trading day. It encapsulates all the buy and sell orders, news, and market participant psychology that occurred between the opening and closing bells. It acts as a reference point for the next day’s trading and contributes to weekly, monthly, and annual performance metrics. A strong close often indicates bullish sentiment carrying over into the next session, while a weak close can suggest lingering concerns or a lack of buying interest.
Volume and Volatility Insights
Beyond the points gained or lost, the trading volume accompanying the Dow’s movement provides crucial context. High volume on a significant move (up or down) suggests conviction behind that movement, indicating broad market participation. Conversely, a large move on low volume might be less significant, potentially indicating a lack of broad consensus or simply profit-taking in a thin market. Volatility, or the degree of price fluctuation throughout the day, also tells a story. High volatility often accompanies uncertainty or major news events, while low volatility can suggest a calmer, more predictable market environment. Observing these supplementary metrics alongside the closing price paints a more complete picture of the market’s health and direction.
Market Sentiment and Investor Psychology
Ultimately, the daily close of the Dow Jones is a reflection of collective market sentiment. It captures the fears, hopes, and expectations of millions of investors worldwide. Positive corporate earnings, favorable economic data, or progress on geopolitical issues can fuel optimism, leading to upward momentum. Conversely, inflation concerns, interest rate hikes, or global instability can trigger sell-offs driven by fear and uncertainty. Understanding that the market is not always rational and can be swayed by emotional responses is key to interpreting its daily gyrations and avoiding impulsive decisions.
Catalysts Behind the Daily Movement
The Dow’s daily performance is never an isolated event. It is the culmination of countless factors, both micro and macro, domestic and international, that influence corporate profitability and investor behavior.
Economic Indicators and Reports

Regularly released economic data provides a fundamental backdrop for market movements. Reports on inflation (Consumer Price Index, Producer Price Index), employment (jobless claims, non-farm payrolls), gross domestic product (GDP), manufacturing surveys, and consumer confidence indices all offer insights into the health and direction of the economy. Positive economic news can boost corporate earnings expectations, leading to higher stock prices, while negative data can signal an economic slowdown, prompting a market downturn. Traders and investors meticulously analyze these reports for clues about future growth and potential policy shifts.
Corporate Earnings and Guidance
Since the Dow comprises 30 large corporations, their individual performance has a direct impact on the index. Quarterly earnings reports, which detail a company’s revenue and profit, are closely watched events. If a significant number of Dow components report stronger-than-expected earnings or provide optimistic guidance for future performance, the index is likely to rise. Conversely, widespread earnings misses or cautious outlooks can drag the Dow down. News related to mergers, acquisitions, product launches, or leadership changes within these companies can also cause individual stock prices to fluctuate, thereby affecting the index.
Geopolitical Events and Global Impact
In an increasingly interconnected world, geopolitical events can send ripples across global markets, including the Dow. Political instability in key regions, international trade disputes, supply chain disruptions, wars, or even major diplomatic breakthroughs can impact commodity prices, currency valuations, and the operating environment for multinational corporations. For instance, an oil price shock stemming from geopolitical tensions could raise energy costs for businesses and consumers, dampening economic growth and potentially leading to a sell-off in the market.
Central Bank Actions and Monetary Policy
Central banks, most notably the U.S. Federal Reserve, play a pivotal role in influencing market dynamics through their monetary policy decisions. Interest rate changes are particularly impactful. When the Fed raises interest rates, borrowing becomes more expensive for businesses and consumers, which can slow economic growth and reduce corporate profits, often leading to a market correction. Conversely, interest rate cuts or quantitative easing measures aim to stimulate the economy, potentially boosting stock prices. Announcements regarding future policy intentions, such as forward guidance on interest rates, are also closely scrutinized and can trigger significant intraday and closing movements in the Dow.
Navigating the Information for Investment Decisions
While the Dow’s daily close provides valuable information, it’s crucial for investors to place this data within a broader context and avoid making rash decisions based on short-term fluctuations.
Broader Market Context: S&P 500 and Nasdaq
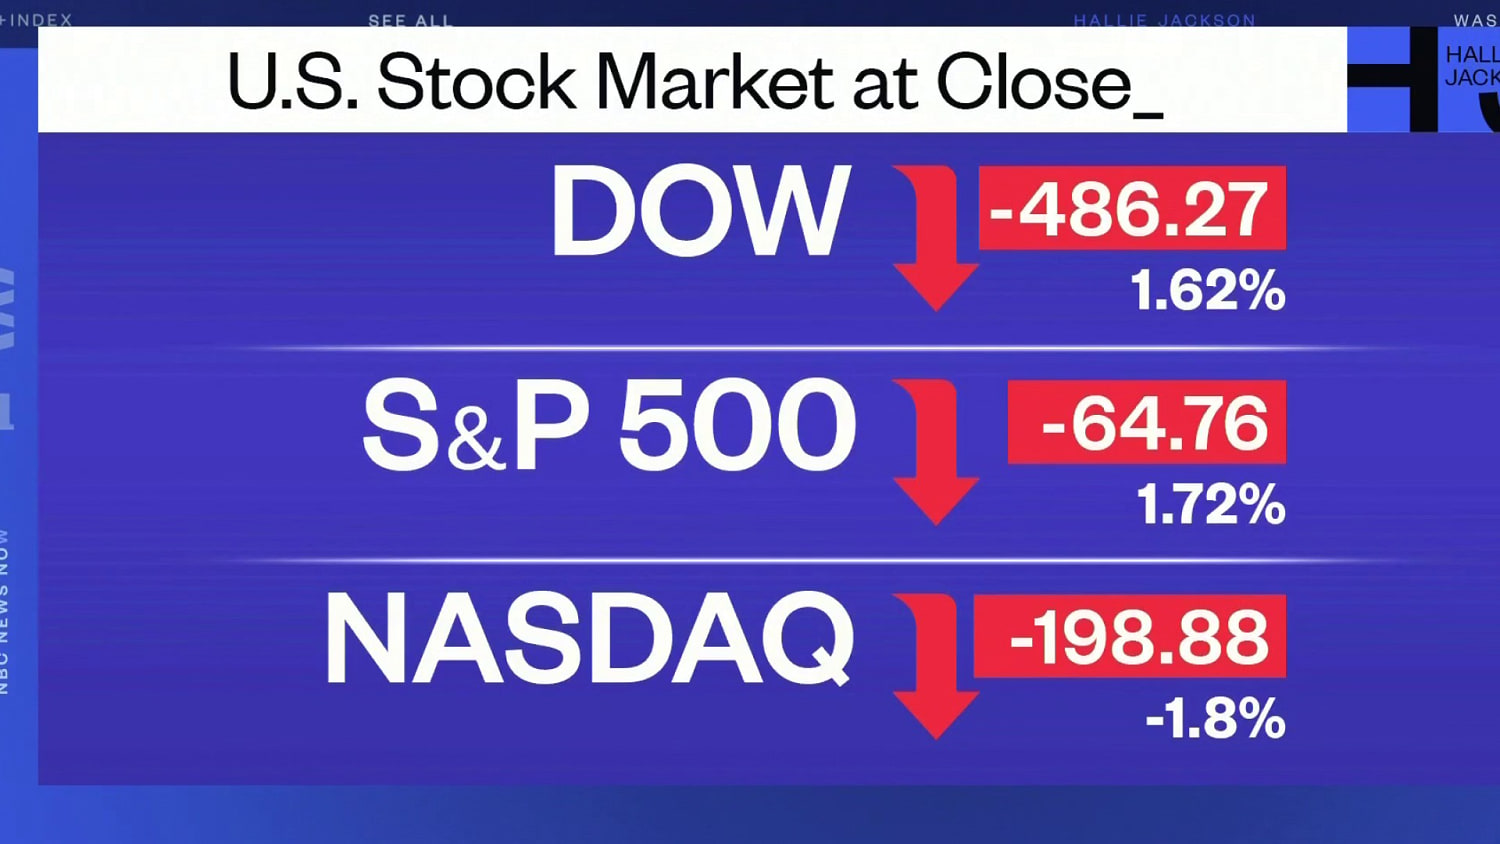
Reliance solely on the DJIA can be misleading because of its limited number of components and price-weighted methodology. It’s often more insightful to compare its performance with other major indices. The S&P 500, which tracks 500 of the largest U.S. companies by market capitalization, is generally considered a more comprehensive benchmark for the overall U.S. stock market. The Nasdaq Composite, heavily weighted towards technology and growth companies, provides insights into a different segment of the economy. Observing whether all major indices are moving in the same direction, or if there’s divergence, can offer a more nuanced understanding of market breadth and sentiment.
Sectoral Analysis and Diversification
The Dow’s components represent diverse sectors, but its performance doesn’t tell the whole story of every industry. A deep dive into specific sectors can reveal underlying strengths or weaknesses that might be masked by the aggregate index number. For individual investors, understanding how various sectors are performing can inform diversification strategies. Diversifying across different sectors and asset classes can help mitigate risk and improve long-term portfolio stability, rather than being overly exposed to the fortunes of just 30 companies or a single market segment.
Long-Term Perspective vs. Daily Fluctuations
For most long-term investors, the daily movements of the Dow are less critical than the broader, multi-year trends. While it’s natural to be curious about how the market closed today, successful investing often involves looking beyond the daily noise. Market volatility is a normal part of investing, and trying to time the market based on daily closes is notoriously difficult and often counterproductive. A disciplined approach, focusing on long-term financial goals, consistent contributions, and a well-diversified portfolio, typically outperforms strategies driven by short-term market reactions.
Essential Resources for Tracking Market Activity
Staying informed about the Dow’s performance and the factors influencing it is easier than ever with a wealth of digital resources available.
Financial News Outlets and Data Providers
Reputable financial news sources like The Wall Street Journal, Bloomberg, Reuters, CNBC, and Yahoo Finance provide real-time updates, end-of-day summaries, expert analysis, and in-depth articles on market movements. These platforms offer not just the headline numbers but also the underlying reasons for market shifts, covering economic reports, corporate news, and geopolitical developments. Many also provide historical data and charts to help investors contextualize current performance.
Brokerage Platforms and Analytical Tools
Most online brokerage platforms offer comprehensive tools for tracking the Dow and other indices. These platforms provide live data feeds, customizable watchlists, charting capabilities, and often integrated news feeds. Investors can set up alerts for significant market movements or specific stock performance. Advanced analytical tools can help in technical analysis, identifying trends, support, and resistance levels, although interpreting these requires knowledge and experience. Utilizing these resources effectively allows investors to monitor the market efficiently and make informed decisions aligned with their financial objectives.
aViewFromTheCave is a participant in the Amazon Services LLC Associates Program, an affiliate advertising program designed to provide a means for sites to earn advertising fees by advertising and linking to Amazon.com. Amazon, the Amazon logo, AmazonSupply, and the AmazonSupply logo are trademarks of Amazon.com, Inc. or its affiliates. As an Amazon Associate we earn affiliate commissions from qualifying purchases.