
Assessing the daily performance of the stock market requires more than just glancing at a headline number. While the question “how much money did the stock market lose today?” seems straightforward, the answer is often complex, involving myriad factors that influence market valuation, investor sentiment, and economic projections. Understanding daily market movements is crucial for both seasoned investors and those new to the financial landscape, offering insights into the broader economic health and potential future trends.
Understanding Market Fluctuations and Daily Volatility
The stock market is a dynamic ecosystem, constantly reacting to new information, investor expectations, and global events. A “loss” on any given day signifies a net decrease in the collective value of traded stocks, typically measured by major market indices.
The Nature of Daily Market Movements
Daily market movements are inherent to the system. Prices fluctuate minute by minute as buyers and sellers interact, driven by supply and demand for individual stocks. A “down day” or a “loss” implies that selling pressure outweighed buying interest across a significant portion of the market, leading to a general decline in asset values. These daily shifts are often influenced by a mix of fundamental data, technical analysis, and psychological factors. It’s rare for the market to remain perfectly flat; some degree of daily change, whether positive or negative, is the norm.
Key Indices and Their Role
When we talk about “the stock market losing money,” we are usually referring to the performance of major market indices. These indices represent a basket of stocks and serve as benchmarks for the overall market’s health.
- Dow Jones Industrial Average (DJIA): Comprises 30 large, publicly traded companies in the United States. Its movements are often cited as a barometer for the broader U.S. economy, though its narrow scope can sometimes skew its representativeness.
- S&P 500 (Standard & Poor’s 500): A broader index tracking the performance of 500 of the largest U.S. companies by market capitalization. It is widely regarded as one of the best gauges of large-cap U.S. equities and the health of the U.S. stock market.
- NASDAQ Composite: Primarily tracks technology and growth companies, often indicating investor sentiment towards innovative sectors.
- Russell 2000: Focuses on small-cap U.S. companies, offering insights into the performance of smaller domestic businesses, which can sometimes behave differently than large-cap stocks.
A decline in these indices indicates that the collective value of the companies they represent has fallen, signaling a general market loss. The magnitude of this loss can be expressed in points (for indices like the DJIA) or as a percentage change.
Factors Influencing Short-Term Performance
Numerous factors can trigger daily market losses. These can range from scheduled economic data releases to unexpected geopolitical events.
- Economic Data: Inflation reports, unemployment figures, GDP growth, manufacturing indices, and consumer confidence surveys all provide critical insights into the economy’s health. Negative surprises in any of these areas can trigger widespread selling.
- Corporate News: Earnings reports, guidance updates, mergers and acquisitions, or even significant product announcements from major companies can have ripple effects, especially if the company is a component of a major index.
- Interest Rate Expectations: Signals from central banks regarding interest rate policy (e.g., the Federal Reserve) significantly impact market sentiment. Higher interest rates can increase borrowing costs for companies and make bonds more attractive relative to stocks.
- Geopolitical Events: International conflicts, political instability, trade disputes, or even natural disasters can create uncertainty, prompting investors to reduce risk exposure.
- Commodity Prices: Significant fluctuations in oil prices or other key commodities can impact corporate profits and consumer spending, influencing market direction.
Quantifying Market Losses: A Closer Look at Metrics
When the stock market “loses money,” it’s not a single, tangible sum disappearing into thin air. Instead, it represents a reduction in the aggregate market capitalization of publicly traded companies.
Percentage Drops vs. Absolute Dollar Figures
The most common way to report market losses is through percentage change. A 1% drop in the S&P 500, for instance, is often considered a significant daily move. Percentage figures are more informative than absolute point drops, as they contextualize the loss against the index’s total value. For example, a 100-point drop on the Dow Jones when it was at 10,000 is a 1% loss, whereas a 100-point drop when it is at 30,000 is only about a 0.33% loss.
Calculating the absolute dollar loss for the entire market is more complex. It would involve summing the change in market capitalization for every publicly traded company. This is why economists and analysts typically focus on the performance of key indices and the percentage changes they represent. However, a rough estimation can be made by looking at the change in market cap of the S&P 500 or NASDAQ and extrapolating. For example, if the total market capitalization of the S&P 500 companies is $40 trillion, a 1% drop equates to a $400 billion reduction in value.
Market Capitalization and Its Impact
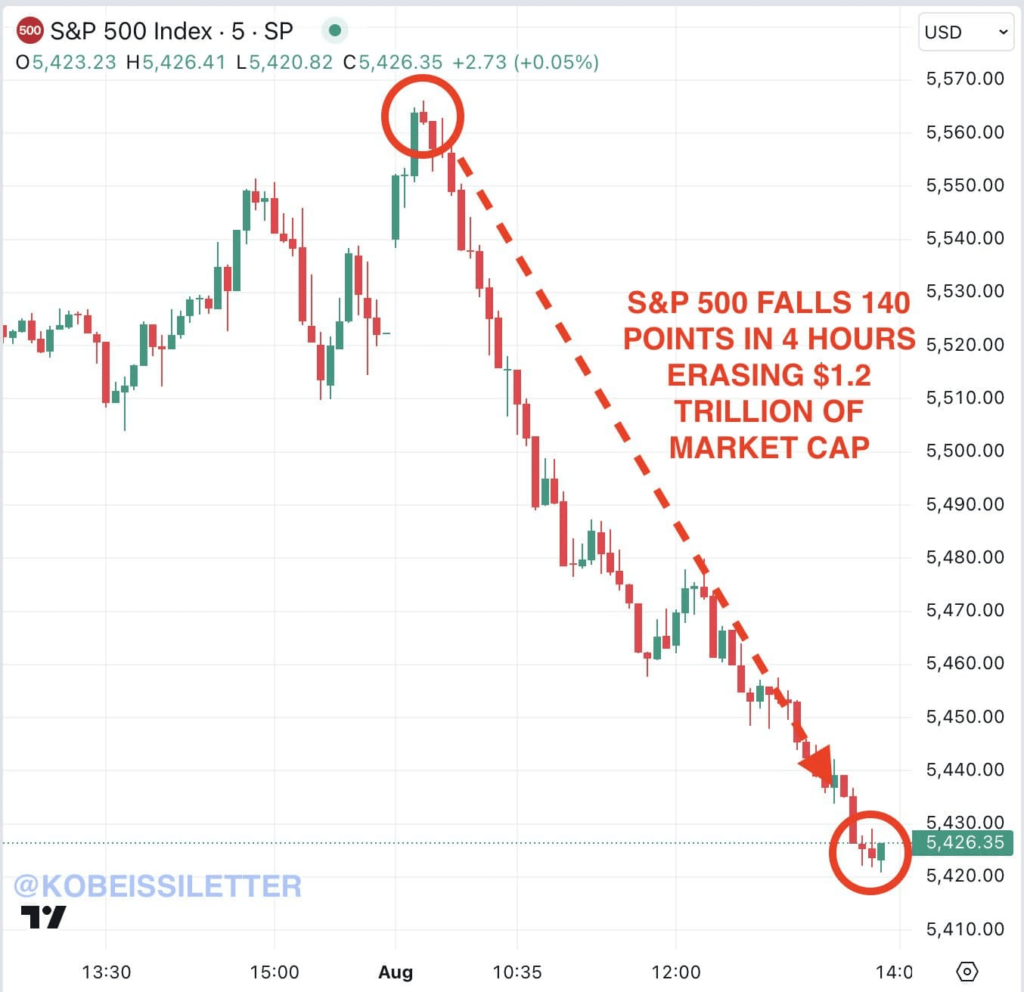
Market capitalization, or “market cap,” is the total value of a company’s outstanding shares. When a company’s stock price falls, its market cap decreases. A market loss reflects the cumulative decrease in the market cap of many companies, especially those with large market capitalizations, as their movements disproportionately affect index performance. A substantial daily market loss therefore indicates that trillions of dollars in theoretical wealth have been erased from investors’ portfolios across the globe.
Beyond the Headline Number: Sectoral Performance
A general market loss doesn’t mean all sectors or individual stocks performed equally poorly. Some sectors might experience sharper declines due to specific industry news, while others might be relatively resilient or even see gains. For example, during a general market downturn, defensive sectors like utilities or consumer staples might hold up better than growth-oriented sectors like technology or discretionary consumer goods. Understanding which sectors are leading the decline can offer clues about the underlying causes and potential long-term implications.
The Underlying Causes of a Down Day
Unpacking the reasons behind a market loss requires examining a confluence of economic, corporate, and psychological factors.
Macroeconomic Indicators and Geopolitical Events
Often, a down day is a reaction to new macroeconomic data that suggests a weakening economy, rising inflation, or an impending recession. For instance, a higher-than-expected inflation report might signal that central banks will need to raise interest rates more aggressively, which is generally bad for stock valuations. Similarly, geopolitical tensions, such as escalating trade wars or military conflicts, introduce uncertainty and risk into global markets, causing investors to seek safety by selling off riskier assets like stocks. These large-scale events can create a widespread “risk-off” sentiment.
Corporate Earnings and Guidance
At the micro-level, corporate performance heavily influences stock prices. Disappointing earnings reports from a few major companies can significantly drag down indices. Even more impactful is negative guidance from companies, where they project lower future earnings or revenues. Such forward-looking pessimism can cause investors to re-evaluate their valuations for entire sectors, leading to a broader market decline. The interconnectedness of supply chains and consumer spending means that weakness in one major company or industry can quickly spread.
Investor Sentiment and Market Psychology
Beyond concrete data, market psychology plays a huge role. Fear and panic can be contagious, leading to self-fulfilling prophecies. If enough investors believe the market will fall, they sell, driving prices down and confirming their initial fear. This can lead to rapid “flash crashes” or sustained selling waves. Conversely, irrational exuberance can drive markets to unsustainable highs. Technical factors, such as breaching key support levels, can also trigger algorithmic selling, exacerbating downward movements even without fresh fundamental news.
Implications for Investors: Navigating a Down Market
For individual investors, a market loss can be unsettling, but it’s crucial to maintain perspective and adhere to a well-defined investment strategy.
Long-Term vs. Short-Term Perspectives
It’s vital to differentiate between daily fluctuations and long-term investment goals. For long-term investors, a single day’s loss, even a significant one, often represents a blip in the grand scheme. Historically, stock markets have trended upwards over decades, recovering from various crises and downturns. Panicking and selling during a down day can lock in losses and prevent participation in subsequent recoveries. Short-term traders, conversely, may be more impacted by daily volatility and might employ specific strategies to profit from or hedge against such movements.
Strategies for Mitigating Risk
- Dollar-Cost Averaging: Investing a fixed amount regularly, regardless of market conditions, means buying more shares when prices are low and fewer when prices are high, averaging out the purchase cost over time.
- Rebalancing: Periodically adjusting portfolio allocations back to their target weights. This often involves selling some assets that have performed well and buying those that have underperformed, effectively “buying low.”
- Setting Stop-Loss Orders: For some investors, particularly those with a shorter time horizon or looking to protect specific gains, a stop-loss order can automatically sell a security if it drops to a certain price, limiting potential losses. However, these can be triggered by temporary volatility.
The Importance of Diversification
Diversification across different asset classes (stocks, bonds, real estate), geographies, and sectors is fundamental. When one part of the portfolio is down, another might be stable or even up, cushioning the overall impact. During a stock market decline, for example, bonds might perform well as investors seek safer havens, illustrating the benefit of a balanced portfolio.
Looking Ahead: What Comes After a Market Drop?
Market declines are an inevitable part of investing. What happens next is a function of underlying economic fundamentals and investor reaction.
Historical Context of Recoveries
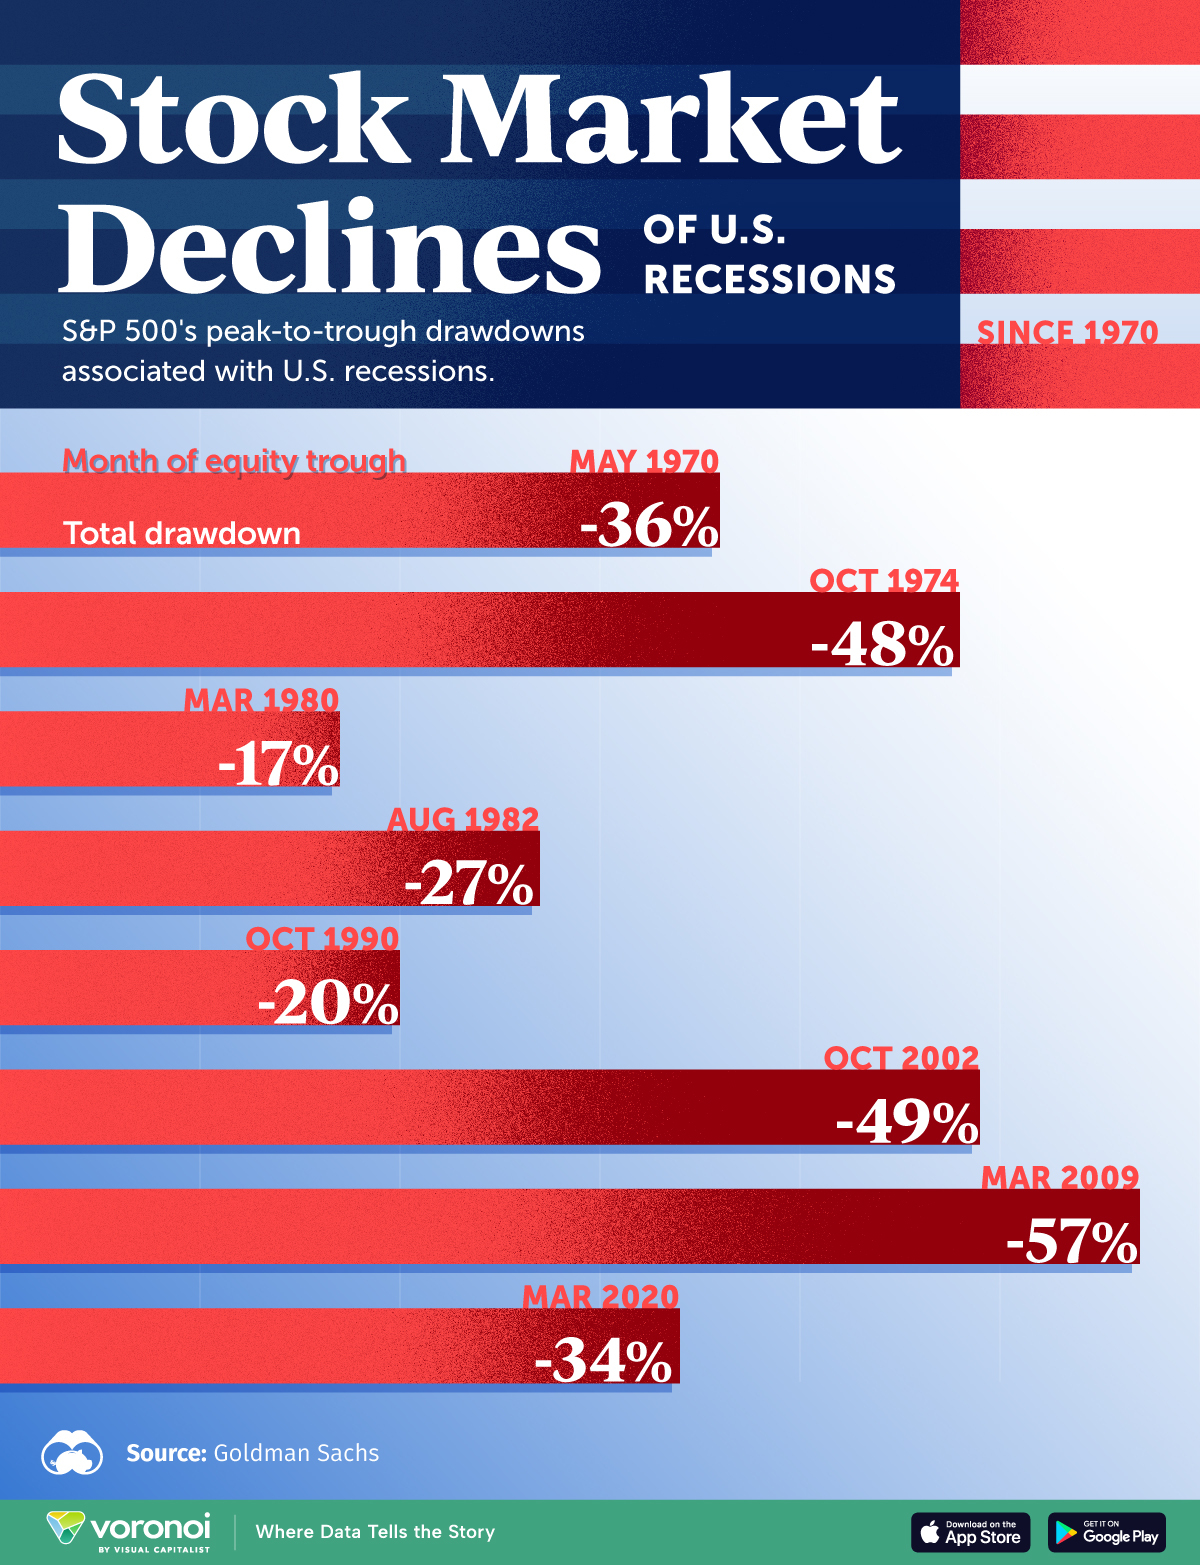
History shows that market downturns are almost always followed by recoveries. While the duration and magnitude of these recoveries vary, markets have consistently bounced back over time. Periods of significant losses often present opportunities for long-term investors to acquire quality assets at reduced prices. Understanding this historical pattern can help temper emotional responses to daily losses.
Economic Resilience and Future Outlook
The ability of an economy to recover from setbacks is critical. Factors such as innovation, government stimulus, corporate adaptability, and consumer spending power all contribute to economic resilience. Analysts constantly evaluate these factors to forecast future market directions. A single down day rarely changes the fundamental long-term outlook of strong companies or a robust economy.

Smart Decisions in Uncertain Times
In times of market uncertainty, prudent financial decisions become paramount. This includes reviewing personal budgets, ensuring adequate emergency savings, and avoiding emotional decisions based on daily headlines. For investors, it means sticking to a well-thought-out investment plan, focusing on quality assets, and potentially viewing downturns as opportunities rather than purely as losses. While the immediate question of “how much money did the stock market lose today?” provides a snapshot, the more meaningful question for financial health is how one plans to navigate the market’s long-term journey.
aViewFromTheCave is a participant in the Amazon Services LLC Associates Program, an affiliate advertising program designed to provide a means for sites to earn advertising fees by advertising and linking to Amazon.com. Amazon, the Amazon logo, AmazonSupply, and the AmazonSupply logo are trademarks of Amazon.com, Inc. or its affiliates. As an Amazon Associate we earn affiliate commissions from qualifying purchases.