
For investors, analysts, and anyone with a keen interest in the financial health of the world’s most influential technology companies, knowing when Alphabet Inc. (the parent company of Google) reports its earnings is a crucial piece of information. These quarterly announcements are not just dates on a calendar; they are pivotal moments that can significantly impact market sentiment, stock prices, and the broader economic outlook. Understanding when, why, and how to analyze these reports is fundamental for informed investment decisions and a deeper comprehension of the global financial landscape.
Understanding Alphabet’s Earnings Reports: A Cornerstone for Investors
Alphabet’s earnings reports provide a transparent look into the financial performance of one of the world’s largest and most diversified corporations. For many, Google is synonymous with search, but Alphabet’s empire extends across advertising, cloud computing, YouTube, autonomous driving (Waymo), and a myriad of “Other Bets” in cutting-edge technologies. Its earnings reports are therefore a rich tapestry of financial data reflecting these diverse operations.

What Are Earnings Reports and Why Do They Matter?
An earnings report is a quarterly (and annual) financial statement released by a public company detailing its profitability and financial health over the preceding period. For Alphabet, these reports typically include:
- Revenue: The total amount of money generated from sales of goods and services. Alphabet’s revenue streams are particularly complex, spanning advertising on Search and YouTube, Google Cloud services, and hardware sales.
- Earnings Per Share (EPS): A key metric indicating how much profit a company makes for each share of its stock. It’s calculated by dividing net income by the number of outstanding shares. Investors closely watch EPS against analyst estimates.
- Net Income: The “bottom line,” representing the company’s profit after all expenses, taxes, and interest have been deducted from revenue.
- Operating Income: The profit a company makes from its core operations, before interest and taxes. This metric helps assess the efficiency of the company’s primary business activities.
- Guidance: Forward-looking statements from management about expected future performance. This can be as impactful as past performance, as it sets expectations for the coming quarters.
These reports matter immensely because they offer a direct assessment of a company’s financial strength, growth trajectory, and operational efficiency. They inform investment strategies, influence stock valuations, and can even signal broader economic trends within the tech sector and beyond.
Alphabet Inc. (GOOGL, GOOG): A Dual-Class Stock Structure
Alphabet is unique among many large companies in having a dual-class stock structure, trading under two ticker symbols: GOOGL (Class A) and GOOG (Class C).
- GOOGL (Class A): These shares carry one vote per share and are the original common stock.
- GOOG (Class C): These shares are non-voting. They were created through a stock split to allow Alphabet’s founders to maintain control of the company while still issuing more shares to the public and for employee compensation.
While their voting rights differ, both classes of stock track the company’s financial performance. When Alphabet reports earnings, the financial figures apply to the company as a whole, affecting the valuation of both GOOGL and GOOG shares, albeit often with slight price discrepancies between the two due to various market factors and liquidity. Investors need to be aware of this structure when tracking earnings impacts.
The Significance for Investors, Analysts, and the Market
For individual and institutional investors, earnings reports are a critical input for portfolio management. Strong earnings can validate an investment thesis, while weak results might trigger re-evaluation. Analysts use these reports to update their financial models, revise price targets, and adjust their recommendations (e.g., “buy,” “hold,” “sell”). The collective reaction of investors and analysts shapes market sentiment around Alphabet, often leading to significant price movements in its stock in the days following the report. Beyond Alphabet itself, its earnings can offer insights into the health of the digital advertising market, cloud computing demand, and consumer spending trends, given its pervasive reach across these sectors.
Pinpointing the Date: How to Track Alphabet’s Earnings Calls
Knowing when Google (Alphabet) reports its earnings is the first step in preparing for this significant financial event. While the exact dates vary slightly each quarter, they generally follow a predictable pattern.
Official Sources: Alphabet Investor Relations Website
The most accurate and reliable source for Alphabet’s earnings release dates and related materials is its official Investor Relations website. This is the definitive hub for all financial information, including:
- Upcoming Events: A calendar listing the exact date and time of the next earnings release and conference call.
- Press Releases: The full text of the earnings announcement, including detailed financial tables.
- SEC Filings (10-Q, 10-K): Quarterly (10-Q) and annual (10-K) reports filed with the U.S. Securities and Exchange Commission, providing comprehensive financial data.
- Live Webcasts and Transcripts: Access to the live earnings call and an archive of past call transcripts and recordings.
Navigating to investor.google.com (or investor.alphabet.com) is always the recommended first step for current and prospective investors seeking official information.
Financial News Outlets and Data Providers
For quick access and consolidated information, numerous reputable financial news outlets and data providers track and report earnings dates for major companies like Alphabet:
- Bloomberg, Reuters, The Wall Street Journal: These major financial news services typically announce earnings dates well in advance and provide extensive coverage on the day of the release.
- Yahoo Finance, Google Finance, CNBC, MarketWatch: These platforms offer dedicated earnings calendars and company-specific pages where you can find the upcoming earnings date, past reports, and analyst estimates.
- Brokerage Platforms: Most online brokerage accounts integrate earnings calendars directly into their platforms, allowing investors to easily track companies in their portfolio or watchlist.
While these sources are generally reliable, it’s always good practice to cross-reference with the official Investor Relations site, especially for critical dates.
Understanding the Earnings Cycle: Quarterly Reporting
Public companies in the U.S. are required to report their financial results on a quarterly basis. Alphabet, like most companies, follows a calendar fiscal year, meaning its quarters align with the standard calendar:
- Q1 Earnings: Typically released in late April (covering January, February, March).
- Q2 Earnings: Usually released in late July (covering April, May, June).
- Q3 Earnings: Often released in late October (covering July, August, September).
- Q4 Earnings (and Full Year): Generally released in late January or early February of the following year (covering October, November, December, and the full prior year).
These reports are usually released after market close or before market open to allow investors time to digest the information without disrupting active trading hours. The earnings call, where management discusses results and answers analyst questions, typically follows shortly after the report’s release.
Decoding Alphabet’s Financials: Key Metrics to Watch
Once the earnings report is out, the real work begins for investors: sifting through the data to understand the underlying performance and future implications. Alphabet’s reports are extensive, but certain key metrics and segments consistently draw the most attention.
Revenue Segmentation: Google Search, Cloud, YouTube, Other Bets
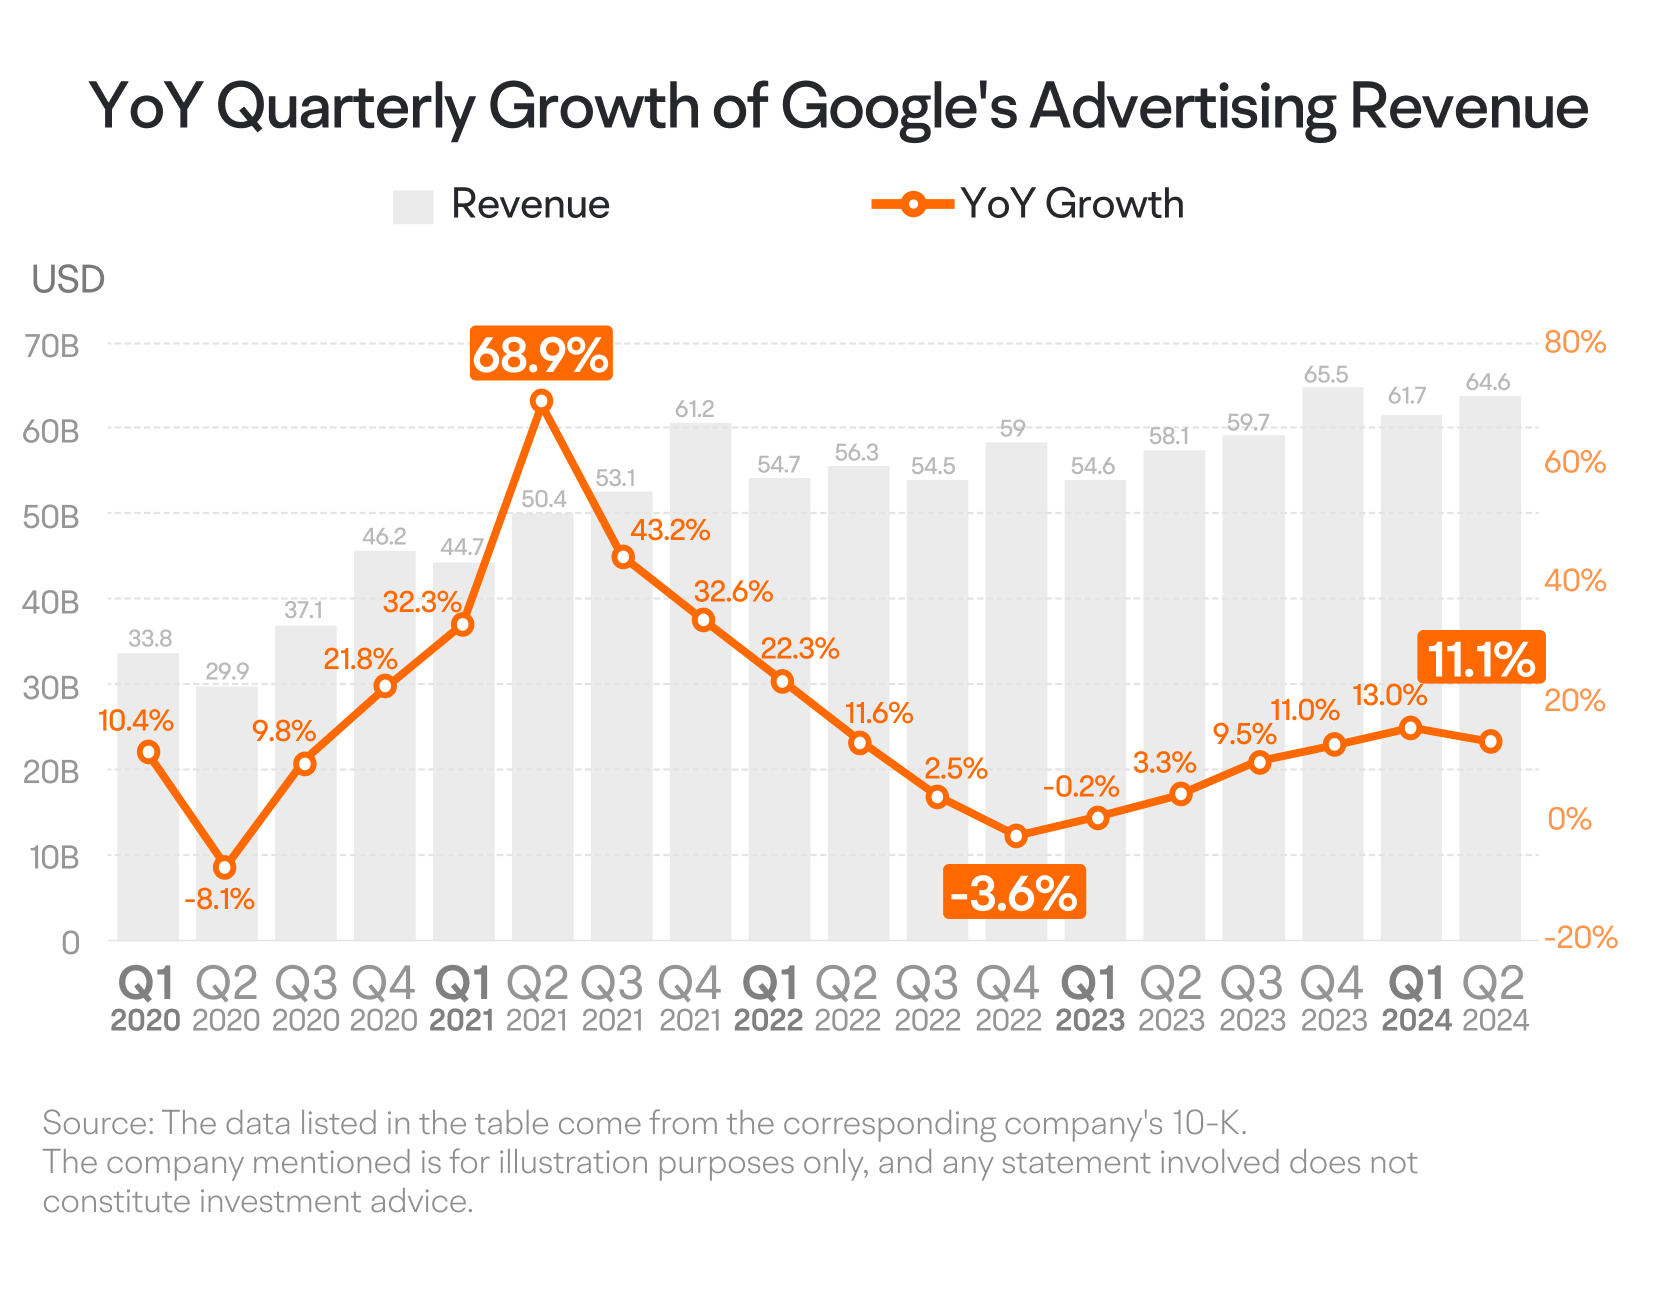
Alphabet’s diverse operations mean its revenue is broken down into several critical segments:
- Google Search & Other: This remains Alphabet’s largest revenue driver, primarily from advertising displayed on Google Search and other owned properties. Investors watch for growth rates here as a barometer for the digital advertising market and Google’s core dominance.
- YouTube Ads: Advertising revenue from YouTube. Its growth indicates the health of the video advertising market and YouTube’s competitive position against other streaming and social platforms.
- Google Network: Revenue from Google ads on partner websites.
- Google Cloud: Revenue from Google’s cloud computing services (Google Cloud Platform and Google Workspace). This segment’s growth is crucial as it represents Alphabet’s push into enterprise services and competes directly with Amazon Web Services (AWS) and Microsoft Azure. Investors look not just at revenue growth but also at its path to profitability.
- Other Bets: This segment includes a range of ambitious, long-term projects like Waymo (self-driving cars), Verily (life sciences), and Fiber (internet services). While often loss-making, growth in these areas can signal future potential. The size of their losses is also closely watched.
- Other Revenues: This includes hardware sales (Pixel phones, Nest devices), Google Play revenue, and non-advertising YouTube subscriptions.
Analyzing the growth and profitability of each segment provides a nuanced view of Alphabet’s overall health and diversification strategy.
Profitability Metrics: Net Income, Operating Income, and Margins
Beyond top-line revenue, investors delve into profitability:
- Net Income: The ultimate profit figure. It’s often compared to analyst estimates and prior periods.
- Operating Income: This shows profit generated from core business operations before accounting for non-operating expenses like interest and taxes. Comparing operating income to revenue gives the Operating Margin, a key indicator of operational efficiency.
- Gross Margin: The percentage of revenue left after deducting the cost of goods sold. A strong gross margin indicates efficient cost management in producing services or goods.
- Free Cash Flow (FCF): The cash a company generates after accounting for cash outflows to support operations and maintain its capital assets. FCF is a strong indicator of financial health and a company’s ability to invest in growth, pay down debt, or return capital to shareholders.
These metrics help assess whether Alphabet is not just growing, but doing so profitably and efficiently.
Growth Drivers and Future Outlook: Guidance and Management Commentary
Perhaps as important as the historical numbers is what management says about the future.
- Guidance: Companies often provide forecasts for future revenue, EPS, or other key metrics. This guidance significantly influences analyst expectations and can cause large stock movements if it deviates from what the market anticipates.
- Management Commentary: During the earnings call, executives discuss current trends, strategic priorities, new product launches, competitive landscape, and capital allocation plans. This commentary provides context to the numbers and reveals insights into the company’s long-term vision and challenges.
Investors pay close attention to remarks concerning advertising spend trends, cloud adoption, AI investments, regulatory challenges, and global economic conditions, all of which can affect Alphabet’s future performance.
Shareholder Value: Share Buybacks and Potential Dividends
While Alphabet does not currently pay a regular dividend, it frequently engages in significant share buyback programs.
- Share Buybacks: When a company repurchases its own shares from the open market, it reduces the number of outstanding shares, which can boost EPS and signal management’s confidence in the company’s valuation. Alphabet has committed tens of billions of dollars to buybacks, a key way it returns value to shareholders.
Investors monitor the size and execution of these programs as an indicator of capital allocation strategy and commitment to shareholder returns.
The Impact and Aftermath of an Earnings Call
The moments leading up to, during, and after an Alphabet earnings call are often characterized by heightened market activity and significant price fluctuations.
Market Reaction: Volatility and Stock Price Movement
The immediate market reaction to an earnings report can be swift and dramatic.
- Pre-Market/After-Hours Trading: Because reports are usually released outside of regular trading hours, initial reactions manifest in extended-hours trading. If results significantly beat or miss expectations, or if guidance is surprisingly strong or weak, the stock can gap up or down substantially.
- Regular Trading Session: The next day, volatility often continues as more investors and algorithmic traders react to the news, and analysts begin to publish their updated assessments.
These movements reflect the market’s collective interpretation of the financial data and future outlook. It’s not just about the absolute numbers, but how they compare to the consensus estimates of analysts. Beating estimates, even with lower growth, can sometimes lead to a rally, while missing them can trigger a sell-off.
Analyst Revisions and Price Targets
Immediately following an earnings report, financial analysts covering Alphabet will update their models.
- Rating Changes: Analysts may upgrade, downgrade, or reaffirm their ratings based on the new information.
- Price Target Adjustments: Their 12-month price targets for GOOGL/GOOG shares will be revised to reflect the latest financial performance and future projections.
These revisions can influence institutional investment decisions and continue to shape market sentiment in the days and weeks after the report.
Long-Term Investment Strategy: Beyond Quarterly Noise
While the immediate market reaction can be captivating, long-term investors are encouraged to look beyond the quarterly “beat or miss” headlines. A single quarter’s performance rarely defines a company as robust and diversified as Alphabet.
- Fundamental Analysis: Focus on the underlying business trends, competitive positioning, innovation pipeline, and management’s strategic execution over multiple quarters and years.
- Growth Trajectory: Is the company maintaining its growth drivers? Are new segments gaining traction?
- Profitability Trends: Is Alphabet consistently generating strong margins and free cash flow?
- Balance Sheet Strength: How much cash does it have? What’s its debt level?
A strong earnings report is positive, but sustained performance and a clear long-term vision are what truly build investor confidence over time. Conversely, a single weak quarter, if the underlying fundamentals remain strong, might represent a buying opportunity for a patient investor.
Participating in the Earnings Call: An Investor’s Guide
For those who want to delve deeper than the press release, participating in or reviewing the earnings conference call is invaluable.
Live Webcasts and Transcripts
Alphabet’s Investor Relations website provides access to live webcasts of its earnings calls. These calls typically begin with prepared remarks from the CEO and CFO, discussing the quarter’s highlights and challenges, followed by a question-and-answer session with financial analysts.
- Live Participation: Listening live offers real-time insights and the ability to gauge management’s tone and confidence.
- Archived Webcasts and Transcripts: If you can’t listen live, archives are typically available within hours or days. Reading the transcript allows for a detailed review of statements and responses, which can be particularly useful for identifying key themes and subtle shifts in strategy or outlook.
The Q&A Session: Insights from Analyst Questions
The question-and-answer segment is often the most revealing part of the earnings call. Analysts pose pointed questions about specific revenue segments, profitability drivers, competitive threats, capital allocation, regulatory concerns, and future growth initiatives. Management’s responses can:
- Clarify Ambiguities: Provide additional context to the numbers presented in the press release.
- Reveal Strategic Priorities: Highlight areas of focus for the company in the coming quarters.
- Offer Forward-Looking Commentary: Often give more detailed color on guidance and market conditions than the prepared remarks.
Listening carefully to the questions and management’s detailed answers provides a richer, more nuanced understanding of Alphabet’s business and prospects than merely scanning the headline numbers.
In conclusion, understanding “when is Google’s earnings” is merely the starting point. For any serious investor, delving into Alphabet’s quarterly reports is an essential exercise in financial analysis. It’s a critical tool for assessing current performance, understanding future potential, and making informed decisions in the dynamic world of investing. By leveraging official sources, dissecting key metrics, and tuning into management commentary, investors can gain invaluable insights into the financial engine driving one of the world’s most influential companies.
aViewFromTheCave is a participant in the Amazon Services LLC Associates Program, an affiliate advertising program designed to provide a means for sites to earn advertising fees by advertising and linking to Amazon.com. Amazon, the Amazon logo, AmazonSupply, and the AmazonSupply logo are trademarks of Amazon.com, Inc. or its affiliates. As an Amazon Associate we earn affiliate commissions from qualifying purchases.