
The seemingly simple question of “how is the inflation rate calculated?” unlocks a profound understanding of economic health, personal financial planning, and the strategies of businesses and central banks alike. Inflation, at its core, represents the rate at which the general level of prices for goods and services is rising, and consequently, the purchasing power of currency is falling. While the concept might appear abstract, its measurement is a sophisticated, data-intensive process that impacts everything from your grocery bill to the interest rates on your mortgage.
Understanding the methodology behind inflation calculation is not merely an academic exercise; it is a critical skill for anyone navigating the financial landscape. For individuals, it dictates how far their savings will stretch in retirement. For investors, it determines the “real” return on their portfolios. For businesses, it influences pricing strategies, wage negotiations, and capital expenditure decisions. And for central banks, the accurate measurement of inflation is the bedrock of monetary policy, guiding decisions on interest rates and money supply to maintain economic stability. This article will delve into the intricacies of inflation measurement, exploring the primary indices, the steps involved in their calculation, the inherent challenges, and their far-reaching implications for your money and the broader economy.
The Core Concept of Inflation and Its Measurement
Before diving into the mechanics, it’s essential to firmly grasp what inflation is and why its accurate measurement is paramount. Inflation is not merely a single price going up; it’s a sustained increase in the general price level across a broad range of goods and services over a period.
Defining Inflation: What It Means and Its Impact
Inflation signifies that each unit of currency buys fewer goods and services than it did previously. This erosion of purchasing power is its most tangible effect. A modest, predictable level of inflation is often considered a sign of a healthy, growing economy, encouraging consumption and investment. However, high or volatile inflation can be detrimental, creating economic uncertainty, discouraging long-term planning, and potentially leading to social unrest if wages don’t keep pace with rising costs. Conversely, deflation – a sustained decrease in prices – can be equally damaging, as it encourages consumers to delay purchases, leading to reduced demand, production cuts, and job losses.
Why Measurement Matters: Economic Policy, Investment Decisions, Purchasing Power
The precise calculation of inflation is vital for several key reasons:
- Economic Policy: Central banks, such as the Federal Reserve in the U.S. or the European Central Bank, set monetary policy targets, primarily around inflation and employment. Their decisions on interest rates, for instance, are heavily influenced by current and projected inflation rates.
- Investment Decisions: Investors need to understand inflation to calculate real returns on their investments (nominal return minus inflation). High inflation erodes bond returns, can make certain stocks less attractive, and encourages investment in assets like real estate or commodities that might serve as inflation hedges.
- Purchasing Power: For individuals, inflation directly affects their standard of living. Wages and fixed incomes, like pensions, lose value if they don’t adjust upwards with inflation. Understanding these changes helps individuals plan their budgets, savings, and retirement.
- Business Planning: Businesses must account for inflation in their budgeting, pricing of products and services, wage negotiations, and long-term investment strategies.
Key Indices Used for Measuring Inflation
Governments and economic agencies employ various indices to track inflation, each with a specific focus and methodology. The most prominent are the Consumer Price Index (CPI), the Producer Price Index (PPI), and the Personal Consumption Expenditures (PCE) Price Index.
The Consumer Price Index (CPI): The Most Common Measure
The CPI is perhaps the most widely recognized measure of inflation, designed to track changes in the prices of goods and services purchased by urban consumers. It’s often referred to as the “cost of living” index.
-
How the CPI Basket Is Determined: The U.S. Bureau of Labor Statistics (BLS), like similar agencies globally, constructs a “market basket” of goods and services that a typical urban household consumes. This basket includes everything from food and housing to transportation, medical care, education, and recreation. The composition and weighting of items in this basket are determined through extensive consumer expenditure surveys, ensuring it reflects actual spending patterns. The weights are crucial; for example, housing costs typically have a much higher weight than, say, entertainment expenses, reflecting their relative importance in a household budget.
-
Data Collection and Methodology: BLS field staff collect price data monthly from thousands of retail stores, service establishments, and rental units across numerous urban areas. Prices are gathered for a consistent set of items, attempting to account for brand, size, and other specifications.
-
Calculating the CPI: The CPI for a given period is calculated using the following formula:
$$text{CPI} = frac{text{Cost of Market Basket in Current Year}}{text{Cost of Market Basket in Base Year}} times 100$$
The “base year” or “reference period” is assigned an index value, typically 100. If the CPI for a subsequent period is 105, it means prices have risen by 5% compared to the base period.
The Producer Price Index (PPI): Measuring Inflation at the Wholesale Level
The PPI measures the average change over time in the selling prices received by domestic producers for their output. Unlike the CPI, which focuses on the consumer’s perspective, the PPI captures prices at various stages of production, from raw materials to finished goods.
- What It Includes: The PPI covers goods, services, and construction products. It’s often broken down into categories like crude goods, intermediate goods, and finished goods, providing insight into inflationary pressures throughout the supply chain.
- Significance as a Leading Indicator: Changes in the PPI can often foreshadow changes in the CPI, as increases in producer costs are frequently passed on to consumers. Therefore, the PPI is considered a valuable leading indicator of future consumer inflation.
The Personal Consumption Expenditures (PCE) Price Index: The Fed’s Preferred Measure
The PCE Price Index, compiled by the Bureau of Economic Analysis (BEA), measures the prices of goods and services purchased by, or on behalf of, U.S. residents. While less widely known by the general public than the CPI, it is the Federal Reserve’s preferred measure of inflation for monetary policy decisions.
- Differences from CPI:
- Scope: PCE has a broader scope, including purchases made on behalf of households (e.g., employer-provided health insurance) that are not typically captured by the CPI.
- Weighting: CPI uses a fixed market basket based on consumer surveys, while PCE uses expenditure weights that are updated quarterly, allowing for greater flexibility and better reflection of current spending patterns and consumer substitution (e.g., if chicken prices rise, people might buy more beef).
- Formulas: PCE uses a chain-type Fisher price index, which is considered more accurate at reflecting changes in consumer behavior than the fixed-basket Laspeyres formula used by the CPI.
- Core PCE vs. Headline PCE: Like the CPI, the PCE index is often reported in two forms: “headline” PCE, which includes all goods and services, and “core” PCE, which excludes volatile food and energy prices. Core PCE is often favored by policymakers as it provides a clearer signal of underlying inflationary trends, filtering out temporary price shocks.
Steps in Calculating the Inflation Rate
While the specific formulas and data sources vary slightly between indices, the general process for calculating inflation involves several consistent steps.
Step 1: Selecting a Base Period and Market Basket
The first crucial step is to define a base period (e.g., a specific year or quarter) against which all future prices will be compared. Concurrently, a representative “market basket” of goods and services is identified. This basket must reflect typical expenditure patterns for the target population (consumers for CPI, producers for PPI). The composition and relative importance (weights) of items in this basket are determined through extensive surveys.
Step 2: Collecting Price Data
Once the market basket is established, data collectors systematically gather price information for each item in the basket. This involves surveying thousands of retail outlets, service providers, and producers across various geographic locations. Price data must be collected consistently for identical items over time to ensure comparability. For example, if tracking the price of a specific model of smartphone, the exact model, storage capacity, and carrier options must be consistent in each period.
Step 3: Calculating the Cost of the Basket
With the price data in hand, the next step is to calculate the total cost of the market basket for the current period. This involves multiplying the price of each item by its quantity or weight in the basket and then summing these weighted prices. This process is repeated for the base period as well, to establish a reference cost.
Step 4: Computing the Index Value
Using the cost of the market basket in the current period and the base period, the index value (e.g., CPI, PPI) is computed. As shown earlier for the CPI, this typically involves dividing the current period’s basket cost by the base period’s basket cost and multiplying by 100 to express it as an index number, with the base period index usually set at 100.

Step 5: Determining the Inflation Rate
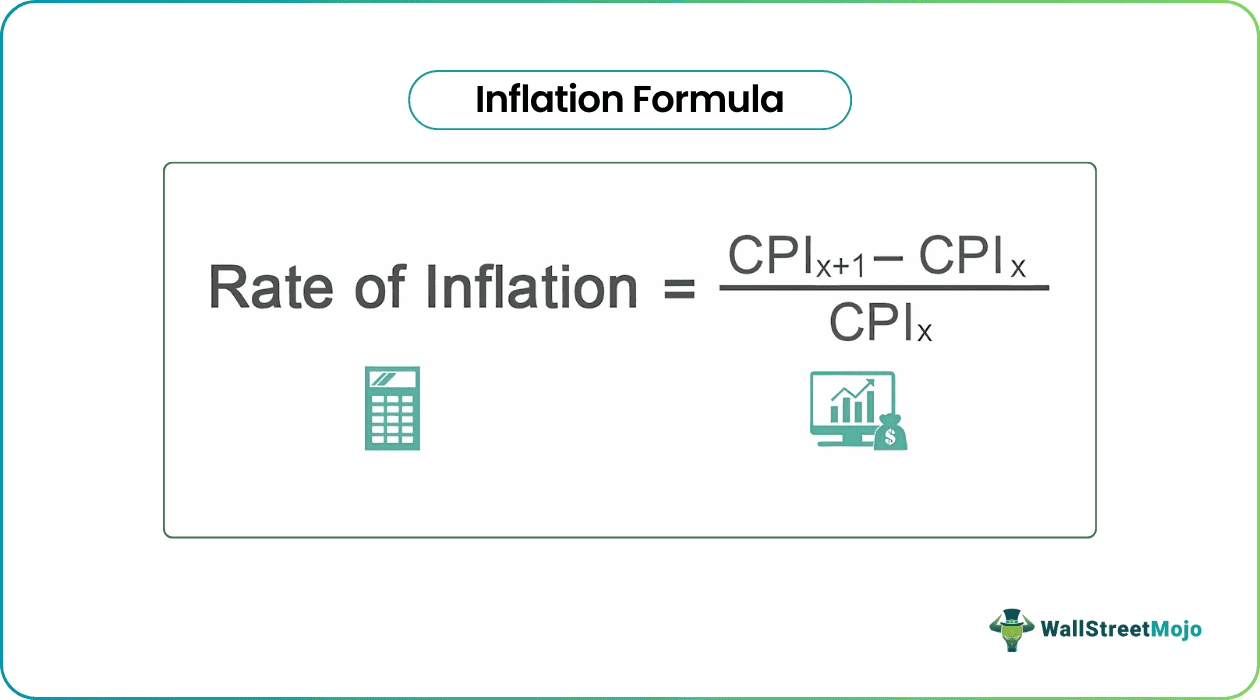
Finally, the inflation rate is calculated as the percentage change in the index value from one period to another. The most common measure is the year-over-year inflation rate, which compares the index value in the current month to the same month in the previous year. This helps to smooth out seasonal fluctuations.
$$text{Inflation Rate (Year-over-Year)} = frac{text{(Current Period Index} – text{Previous Year’s Period Index)}}{text{Previous Year’s Period Index}} times 100$$
For example, if the CPI was 298.915 in December 2022 and 306.771 in December 2023, the year-over-year inflation rate would be:
$$frac{(306.771 – 298.915)}{298.915} times 100 approx 2.63%$$
This means that prices, as measured by the CPI, rose by approximately 2.63% over that 12-month period.
Nuances and Challenges in Inflation Measurement
While the calculation methods are robust, measuring inflation accurately is fraught with complexities and inherent biases. Economic statisticians constantly work to refine methodologies to capture the dynamic nature of markets and consumer behavior.
Substitution Bias
When the price of a particular good rises significantly, consumers often substitute it with a cheaper alternative. For example, if steak prices soar, people might buy more chicken. A fixed market basket, like that initially used in older CPI calculations, doesn’t immediately account for this substitution. This can lead to an overestimation of the true cost of living increase, as it assumes consumers continue to buy the more expensive item. Modern indices, like the PCE, incorporate chain-weighting techniques to mitigate this bias more effectively.
Quality Bias
Over time, the quality of goods and services often improves. A smartphone today is vastly more powerful and feature-rich than one from a decade ago, even if its nominal price is similar. Inflation measures struggle to disentangle price increases due to genuine quality improvements from “pure” inflation. If a product becomes more expensive because it’s significantly better, some of that price increase might not represent an erosion of purchasing power. Ignoring quality improvements can lead to an overestimation of inflation.
New Goods Bias
The market is constantly flooded with new products and services that weren’t available in previous periods. Think of streaming services, electric vehicles, or new medical procedures. These new goods initially have no weight in existing market baskets and are only gradually incorporated, often after their prices have already fallen significantly due to economies of scale and competition. This delay can mean that the benefits of innovation and potentially lower prices from new goods are not fully captured in a timely manner, potentially leading to an overestimation of inflation.
Geographic and Demographic Variations
National inflation figures are averages. The actual experience of inflation can vary significantly across different geographic regions (e.g., cost of living in New York City versus rural Kansas) and demographic groups (e.g., retirees whose spending patterns might differ from young families). A single national CPI or PCE cannot perfectly reflect every individual’s personal inflation rate.
Hedonic Adjustments
To address the quality bias, statistical agencies employ “hedonic adjustments.” This complex statistical technique attempts to estimate how much of a product’s price change is due to changes in its quality or features. For example, if a new computer model costs more but has a faster processor and more memory, hedonic regression tries to isolate the price increase attributable solely to the improved components versus general inflation.
The Broader Implications for Money and Finance
The meticulous process of calculating inflation underpins critical decisions across the financial spectrum, directly influencing personal wealth, investment returns, business viability, and governmental policy.
For Personal Finance: Purchasing Power, Savings, Retirement Planning
Inflation is a silent thief of wealth. It erodes the purchasing power of cash and fixed incomes. For individuals, understanding inflation is crucial for:
- Budgeting: Anticipating rising costs helps in adjusting household budgets.
- Savings: High inflation means money saved in low-interest accounts loses value. Individuals need to seek returns that outpace inflation to preserve their purchasing power.
- Retirement Planning: Retirees on fixed incomes are particularly vulnerable. Inflation requires careful planning to ensure retirement savings will last throughout their golden years.
- Wage Negotiations: Employees often advocate for wage increases that at least match the rate of inflation to maintain their real income.
For Investing: Real Returns, Asset Allocation, Inflation-Protected Securities
Inflation significantly impacts investment strategies:
- Real Returns: The true return on an investment is its nominal return minus the inflation rate. A 5% bond yield offers a negative real return if inflation is 6%.
- Asset Allocation: Investors often adjust their portfolios during periods of high or low inflation. Assets like real estate, commodities (gold, oil), and certain equities can sometimes act as inflation hedges.
- Inflation-Protected Securities: Governments issue bonds like Treasury Inflation-Protected Securities (TIPS) in the U.S., which adjust their principal value in line with inflation, offering investors protection against rising prices.
For Business Finance: Cost Management, Pricing Strategies, Wage Adjustments
Businesses face unique challenges and opportunities related to inflation:
- Cost Management: Rising input costs (raw materials, energy, labor) squeeze profit margins unless effectively managed.
- Pricing Strategies: Companies must decide whether and how to pass on increased costs to consumers through higher prices, balancing profitability with competitive pressures.
- Wage Adjustments: Businesses often need to raise wages to retain talent and maintain employee morale, especially in inflationary environments.
- Capital Expenditure: Decisions on investing in new equipment or facilities are influenced by expected future inflation rates and the cost of capital.

Central Bank Policy: Interest Rates, Monetary Policy Decisions
Central banks are mandated to maintain price stability, typically targeting a specific low and stable inflation rate (e.g., 2% for the Federal Reserve and ECB). Their monetary policy decisions, most notably setting benchmark interest rates, are directly driven by inflation data:
- Combating High Inflation: If inflation is too high, central banks typically raise interest rates, making borrowing more expensive, which slows down economic activity and dampens demand, thereby reducing price pressures.
- Stimulating the Economy: In periods of low inflation or deflation, central banks may lower interest rates to encourage borrowing, spending, and investment, aiming to boost economic growth and bring inflation back to target.
In conclusion, the calculation of the inflation rate is a complex but indispensable process that provides a window into the economic health of a nation. While the various indices like CPI, PPI, and PCE each offer unique perspectives, they collectively form a sophisticated framework for understanding how prices change over time. The inherent challenges in measurement – from substitution and quality biases to the dynamic introduction of new goods – underscore the continuous efforts by statistical agencies to refine their methodologies. For anyone managing personal finances, making investment decisions, running a business, or simply observing the economic landscape, a solid grasp of how inflation is measured and its implications is not just valuable, but essential for informed decision-making in a world where money’s value is constantly in flux.
aViewFromTheCave is a participant in the Amazon Services LLC Associates Program, an affiliate advertising program designed to provide a means for sites to earn advertising fees by advertising and linking to Amazon.com. Amazon, the Amazon logo, AmazonSupply, and the AmazonSupply logo are trademarks of Amazon.com, Inc. or its affiliates. As an Amazon Associate we earn affiliate commissions from qualifying purchases.