
In the complex tapestry of personal finance, investing, and business operations, few concepts are as ubiquitous and critical as the “percentage increase.” Far more than a mere mathematical calculation, understanding percentage increase is a foundational skill that empowers individuals and organizations to accurately assess growth, track performance, make informed decisions, and interpret the ever-shifting landscape of financial data. Whether you’re evaluating the surge in your stock portfolio, deciphering a salary raise, analyzing a company’s sales figures, or trying to grasp the impact of inflation, the ability to calculate and contextualize a percentage increase is indispensable. It transforms raw numbers into meaningful insights, providing a standardized metric for comparison and an essential lens through which to view progress and potential. This article will delve into the essence of percentage increase, exploring its calculation, diverse applications across the money domain, and why it remains a cornerstone of financial literacy.

The Fundamental Calculation: Demystifying Percentage Increase
At its core, calculating a percentage increase is a straightforward process, yet its simplicity belies its profound analytical power. It quantifies the relative change between two values, expressing that change as a fraction of the original value, multiplied by 100 to present it as a percentage. This allows for a universally understood measure of growth or ascent.
The Basic Formula Explained
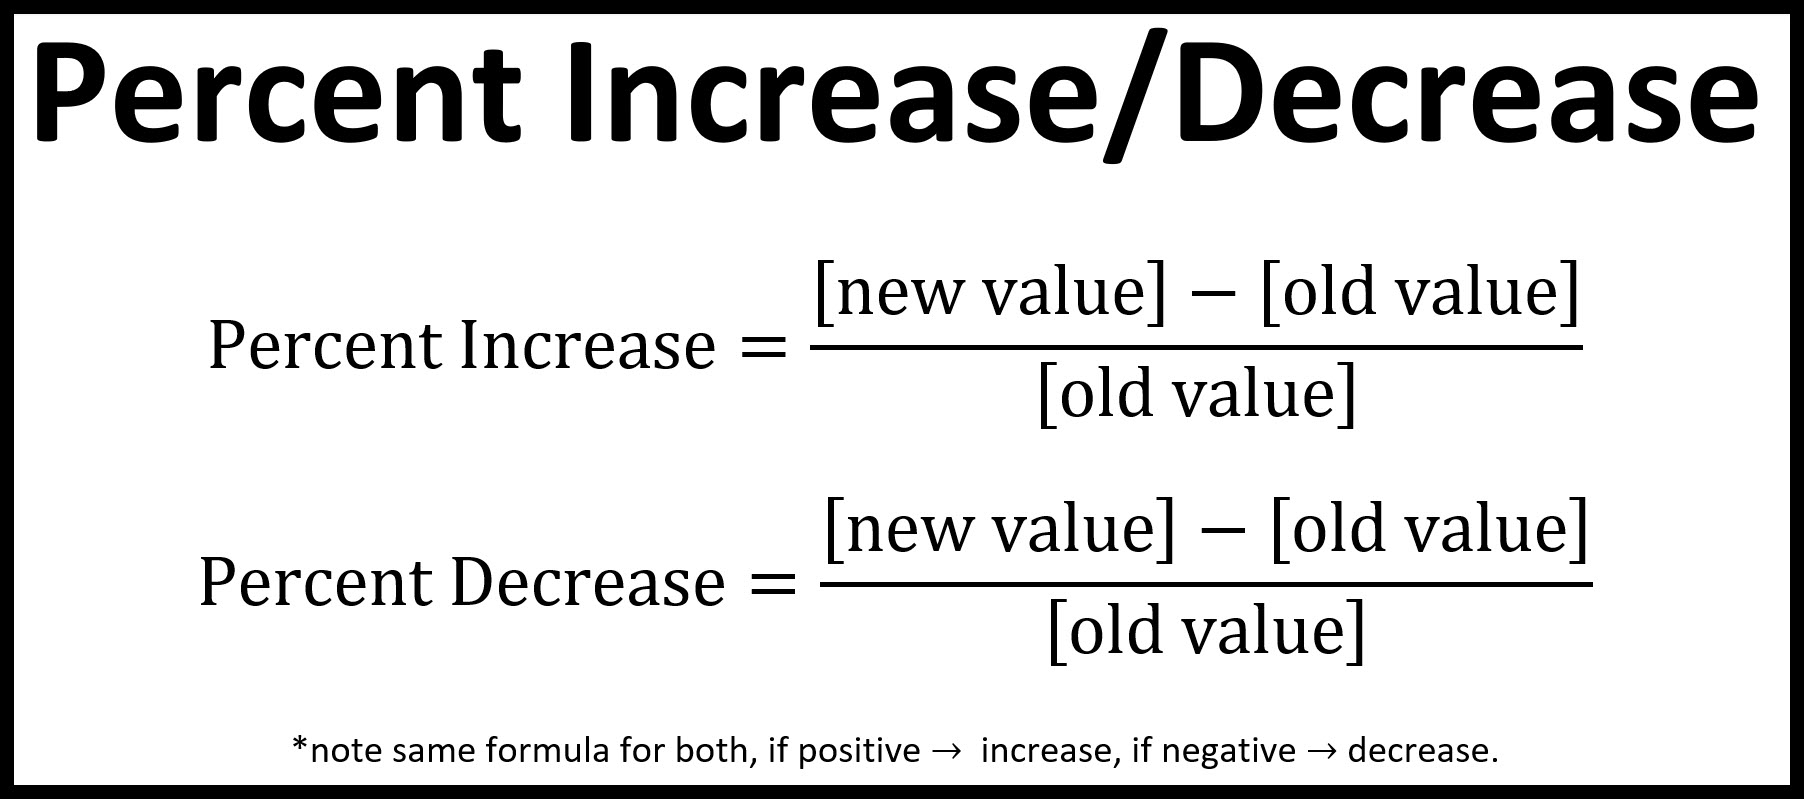
The standard formula for calculating percentage increase is:
$$ text{Percentage Increase} = left( frac{text{New Value} – text{Old Value}}{text{Old Value}} right) times 100 $$
Let’s illustrate with a simple example. Imagine your investment account grew from $10,000 (Old Value) to $12,500 (New Value) over a year.
- Calculate the absolute increase: $12,500 – $10,000 = $2,500
- Divide by the Old Value: $2,500 / $10,000 = 0.25
- Multiply by 100: $0.25 times 100 = 25%$
So, your investment experienced a 25% increase. This single figure immediately communicates the magnitude of growth relative to the initial capital.
Why Not Just Absolute Numbers? The Importance of Context
While absolute numbers tell us the raw difference, they often lack the crucial context needed for meaningful analysis. An increase of $1,000 might seem significant in isolation, but its true impact depends entirely on the base value from which it increased.
Consider two scenarios:
- Scenario A: Your side hustle income increased from $100 to $1,100.
- Scenario B: Your main business revenue increased from $1,000,000 to $1,001,000.
In both cases, the absolute increase is $1,000. However, calculating the percentage increase reveals a stark difference in growth:
- Scenario A: (($1,100 – $100) / $100) * 100 = 1000% increase. This is monumental growth!
- Scenario B: (($1,001,000 – $1,000,000) / $1,000,000) * 100 = 0.1% increase. This is a negligible change.
Without the percentage increase, the raw $1,000 gain in Scenario B could be misleading, suggesting a significant improvement where none truly exists relative to the scale of the operation. Percentages standardize comparison, making financial data actionable and intelligible across different scales.
Common Pitfalls and Misinterpretations
Despite its utility, percentage increase can be a source of confusion if not applied carefully. A common pitfall is confusing “percentage point change” with “percentage change.” For instance, if an interest rate increases from 2% to 3%, that’s a 1 percentage point increase. However, the percentage increase in the interest rate itself is (($3% – 2%) / 2%$) * 100 = 50%. Understanding this distinction is vital to avoid misrepresenting data, particularly in reports or financial news.
Percentage Increase in Personal Finance: Gauging Your Financial Health
For individuals, percentage increase is a powerful diagnostic tool, offering insights into personal financial health and progress towards monetary goals. It moves beyond simple observation to provide a quantifiable measure of success and areas needing attention.
Tracking Investment Growth
One of the most direct applications of percentage increase for individuals is in evaluating investment performance. Whether it’s a stock, a mutual fund, a cryptocurrency, or a real estate property, knowing the percentage increase allows you to:
- Assess Returns: Understand how much your capital has grown relative to your initial investment. An investment that yielded a 15% increase is generally considered better than one that grew by 5%.
- Compare Opportunities: Easily pit different investment options against each other. If Fund A shows a 10% increase over the last year and Fund B shows 8%, you have a clear metric for comparison (though past performance isn’t indicative of future results).
- Understand Compounding: The magic of compound interest relies heavily on percentage increases. Reinvesting your gains means subsequent percentage increases are calculated on a larger base, accelerating wealth accumulation over time.
Understanding Salary Raises and Income Growth
When your employer offers a raise, the first question often is “what percentage increase is that?” This is because a percentage allows you to quickly gauge the raise’s impact relative to your current income. A 5% raise on a $60,000 salary ($3,000) feels different than a 5% raise on a $30,000 salary ($1,500), but both represent the same proportional improvement. Critically, comparing your salary increase percentage against the rate of inflation (also a percentage increase) helps determine if your purchasing power has truly improved or merely kept pace.
Budgeting and Expense Analysis
For effective personal budgeting, tracking percentage changes in spending categories is invaluable. If your “dining out” budget increased by 30% last month, it signals an area for potential adjustment. Conversely, a 10% decrease in utility bills due to energy-saving efforts shows positive progress. This granular analysis empowers individuals to identify spending patterns, make informed adjustments, and optimize their financial outflows.
The Impact of Inflation on Purchasing Power
Inflation, defined as the rate at which the general level of prices for goods and services is rising, is expressed as a percentage increase. A 3% inflation rate means that, on average, items cost 3% more than they did last year. Understanding this percentage is crucial because it directly impacts your purchasing power. If your investments grow by 5% but inflation is 3%, your real return is only 2%. This concept highlights the importance of investments that can outpace inflation to maintain or grow your financial standing.
Business Finance and Strategic Growth: The Enterprise Perspective

In the world of business, percentage increase is not just a metric; it’s a language of performance, growth, and strategic success. From startups to multinational corporations, executives and stakeholders rely on these figures to make critical operational and investment decisions.
Analyzing Sales and Revenue Growth
For any business, the percentage increase in sales and revenue is a primary indicator of market penetration, product success, and overall vitality. A consistent year-over-year (YoY) percentage increase in revenue often signals a healthy, expanding business that is capturing more market share or growing its customer base. Investors scrutinize these figures intensely, as they are a key driver of valuation and future profitability.
Profitability Metrics: Gross and Net Profit Margin Increases
Beyond top-line revenue, businesses must understand how efficiently they convert sales into profit. Percentage increases in profit margins (gross profit margin, operating profit margin, net profit margin) reveal improvements in cost management, pricing strategy, and operational efficiency. For example, a percentage increase in the net profit margin indicates that a larger proportion of each revenue dollar is translating into actual earnings for the company, a very positive sign for financial health.
Cost Management and Efficiency Gains
Conversely, businesses also strive for percentage decreases in various cost categories. A 5% reduction in production costs, a 10% decrease in administrative overhead, or a 15% improvement in supply chain efficiency (often measured as a percentage reduction in waste or lead time) can significantly boost the bottom line. Tracking these changes as percentages allows management to benchmark performance against industry standards and identify areas for further optimization.
Market Share and Competitive Analysis
Companies often measure their success not just by absolute sales but by their percentage of the total market, known as market share. A percentage increase in market share indicates that a business is growing faster than its competitors and capturing a larger portion of the available customer base. This metric is vital for strategic planning, competitive positioning, and assessing brand strength within an industry.
Investing Strategies and Portfolio Performance: Making Informed Decisions
Sophisticated investors and financial professionals utilize percentage increase calculations to delve deeper into investment performance, assess risk, and benchmark against market trends.
Evaluating Investment Returns: CAGR vs. Simple Percentage Increase
While the simple percentage increase is useful for a single period, for investments spanning multiple years, the Compound Annual Growth Rate (CAGR) offers a more accurate picture of performance. CAGR represents the smoothed annualized gain over a specified period, assuming profits were reinvested. It’s calculated as:
$$ text{CAGR} = left( left( frac{text{Ending Value}}{text{Beginning Value}} right)^{frac{1}{text{Number of Years}}} – 1 right) times 100 $$
CAGR provides a standardized way to compare the growth of different investments over varying timeframes, making it a critical tool for long-term investment analysis where the power of compounding is a key factor.
Risk Assessment and Volatility
Percentage change is also fundamental to understanding investment risk. Volatility, often measured as the standard deviation of percentage returns, quantifies how much an investment’s value fluctuates. Percentage drawdowns – the percentage decline from a peak value – are used to assess the maximum loss an investor might experience. Understanding these percentage metrics helps investors gauge the risk-reward profile of assets and construct diversified portfolios aligned with their risk tolerance.
Benchmarking Performance
To determine if an investment strategy is truly successful, investors compare its percentage increase in value against relevant benchmarks (e.g., the S&P 500 for large-cap US stocks, a specific bond index for fixed income). If a portfolio achieved a 12% increase while its benchmark increased by 15%, it underperformed, despite having a positive percentage gain. This comparative analysis is crucial for evaluating fund managers, adjusting asset allocation, and validating investment theses.
Leveraging Financial Tools for Percentage Analysis
Fortunately, in the digital age, calculating and interpreting percentage increases doesn’t require complex manual computations. A variety of financial tools simplify this process, making sophisticated analysis accessible to everyone.
Spreadsheets (Excel/Google Sheets)
Spreadsheet programs are perhaps the most common and versatile tools for financial analysis. With simple formulas, users can quickly calculate percentage increases for large datasets, track trends over time, and visualize changes through charts. For example, to calculate the percentage increase between a value in cell A2 (old) and B2 (new), you’d simply enter =(B2-A2)/A2 and format the cell as a percentage.
Online Calculators and Financial Software
Numerous websites and specialized financial software offer dedicated percentage increase/decrease calculators. These tools are particularly useful for quick, ad-hoc calculations without needing to set up a full spreadsheet. Many personal finance apps and budgeting software also automatically track and display percentage changes in income, expenses, and investment values.
Investment Platforms and Brokerage Dashboards
Modern investment platforms and brokerage accounts often feature sophisticated dashboards that automatically calculate and display the percentage increase (or decrease) of your portfolio, individual holdings, and even specific investment periods. These built-in analytics provide real-time insights into your investment performance, allowing you to monitor growth effortlessly.
Conclusion
The question “what is the percentage increase?” opens the door to a fundamental understanding of financial dynamics. From the individual managing a personal budget and tracking investment returns to the entrepreneur analyzing sales growth and the seasoned investor assessing portfolio performance, the ability to calculate, interpret, and contextualize percentage increases is an indispensable skill. It provides the necessary framework for comparing disparate figures, understanding relative change, and making informed decisions that drive financial health and strategic growth. By mastering this seemingly simple mathematical concept, individuals and businesses alike gain a powerful lens through which to perceive opportunities, identify challenges, and navigate the intricate world of money with greater clarity and confidence. Integrating percentage analysis into your financial toolkit is not merely about crunching numbers; it’s about unlocking deeper insights that empower you to plan, adapt, and ultimately, achieve your financial aspirations.
aViewFromTheCave is a participant in the Amazon Services LLC Associates Program, an affiliate advertising program designed to provide a means for sites to earn advertising fees by advertising and linking to Amazon.com. Amazon, the Amazon logo, AmazonSupply, and the AmazonSupply logo are trademarks of Amazon.com, Inc. or its affiliates. As an Amazon Associate we earn affiliate commissions from qualifying purchases.