
In the intricate world of finance, where every decision can have significant repercussions, understanding percentages isn’t just a useful skill—it’s an absolute necessity. From the daily headlines discussing inflation rates and stock market gains to the personal choices concerning loan interest, savings goals, and shopping discounts, percentages are the universal language of money. They provide a standardized way to compare quantities, measure change, and assess performance, transforming complex financial data into easily digestible insights. Without a solid grasp of how percentages work, individuals and businesses alike are at a distinct disadvantage, potentially overlooking opportunities, misinterpreting risks, and making suboptimal financial choices.

This article delves into the core mechanics of percentages, demonstrating their pervasive application across personal finance, investing, and business operations. We will demystify the calculations, illustrate their practical utility, and equip you with the knowledge to leverage percentages as a powerful tool for informed financial decision-making and wealth building. Whether you’re budgeting for a household, evaluating an investment, or analyzing business performance, mastering percentages is your pathway to greater financial literacy and success.
The Fundamentals: What is a Percentage?
Before we can wield percentages as a financial superpower, it’s crucial to understand their foundational meaning and how they are constructed. A percentage is simply a way of expressing a number as a fraction of 100. The term “percent” itself is derived from the Latin “per centum,” meaning “by the hundred” or “for every hundred.” Represented by the symbol “%”, percentages offer a clear, universal metric for proportionality.
Understanding the Concept
At its core, a percentage converts a part-to-whole relationship into a standardized form. If you say “50% of your income,” it immediately conveys half, regardless of the actual income amount. This standardization is incredibly powerful because it allows for easy comparison between different scenarios or quantities. For instance, comparing a 10% interest rate on a small loan with a 10% return on a large investment provides an instant understanding of relative impact, even if the absolute monetary values differ wildly. A percentage is essentially a fraction where the denominator is always 100. So, 25% is equivalent to 25/100, and 75% is 75/100.
Basic Calculation: Finding a Percentage of a Number
The most fundamental percentage operation is calculating a percentage of a given number. This is a common occurrence in finance, whether you’re calculating a discount, a sales tax, or a commission. The basic formula is straightforward:
Part = (Percentage / 100) * Whole
Alternatively, you can convert the percentage to a decimal first:
Part = Decimal Equivalent * Whole
Let’s look at some financial examples:
- Sales Tax: If an item costs $150 and the sales tax is 8%, the tax amount is (8 / 100) * $150 = 0.08 * $150 = $12.
- Discount: If a $200 jacket is on sale for 25% off, the discount amount is (25 / 100) * $200 = 0.25 * $200 = $50. The new price is $200 – $50 = $150.
- Commission: If you earn a 15% commission on a $1,000 sale, your commission is (15 / 100) * $1,000 = 0.15 * $1,000 = $150.
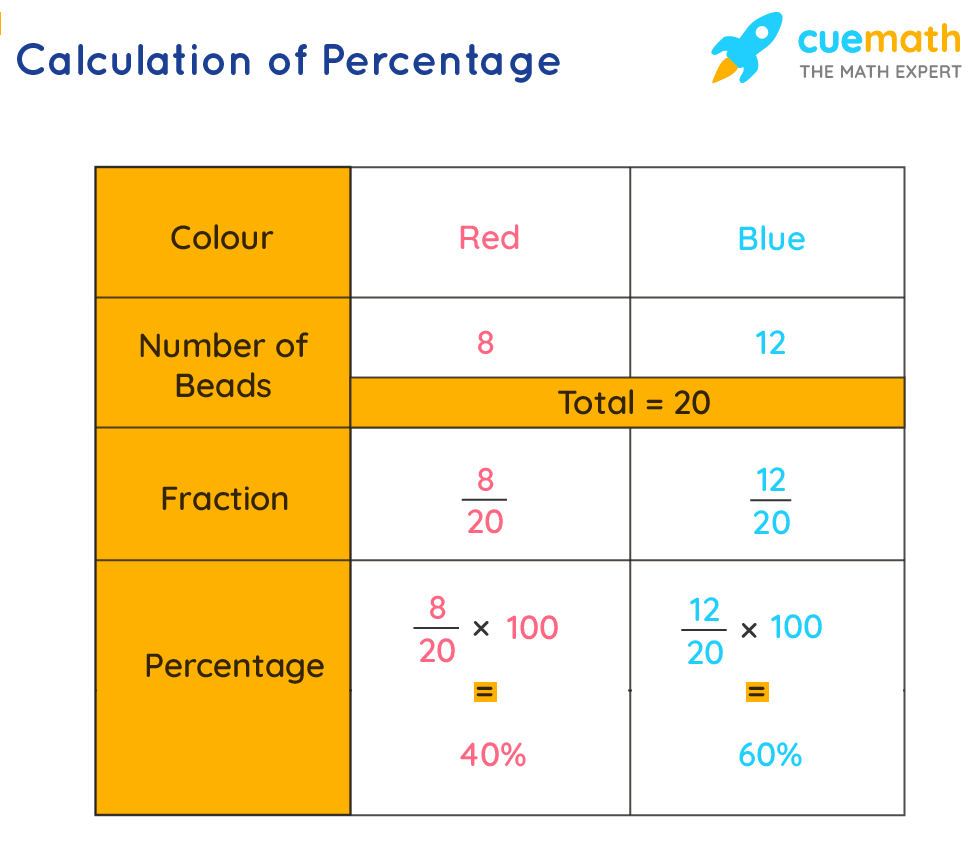
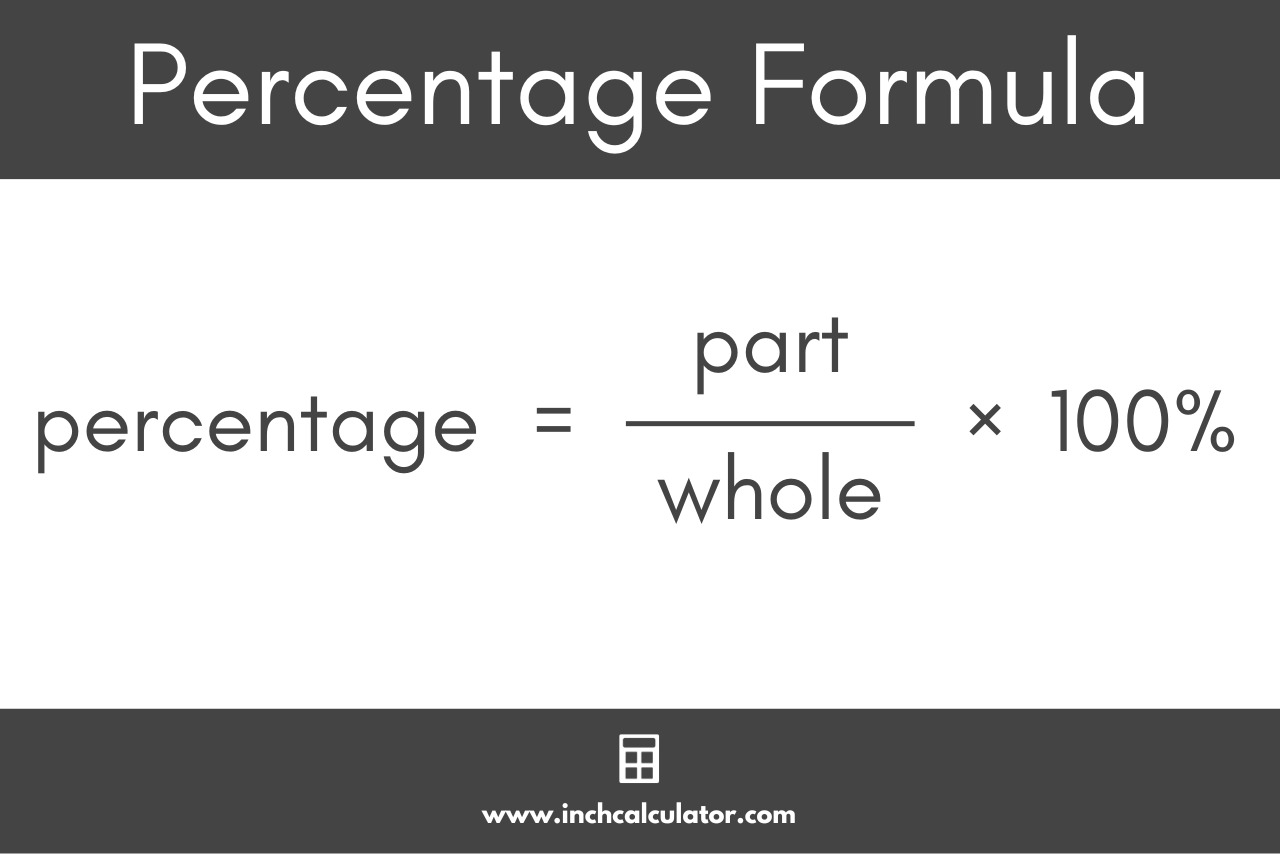
Another common calculation is finding what percentage one number is of another. The formula for this is:
Percentage = (Part / Whole) * 100
- Example: If you spent $300 on groceries from a monthly income of $3,000, your grocery spending is ($300 / $3,000) * 100 = 0.10 * 100 = 10% of your income.
Converting Between Percentages, Decimals, and Fractions
In financial calculations, you’ll frequently need to convert between percentages, decimals, and fractions. Mastering these conversions ensures flexibility and accuracy.
- Percentage to Decimal: Divide the percentage by 100 (or move the decimal point two places to the left).
- 25% = 25 / 100 = 0.25
- 3.5% = 3.5 / 100 = 0.035
- Decimal to Percentage: Multiply the decimal by 100 (or move the decimal point two places to the right and add the ‘%’ symbol).
- 0.75 = 0.75 * 100 = 75%
- 0.012 = 0.012 * 100 = 1.2%
- Percentage to Fraction: Write the percentage as a fraction over 100 and simplify.
- 50% = 50/100 = 1/2
- 20% = 20/100 = 1/5
- Fraction to Percentage: Convert the fraction to a decimal first, then to a percentage.
- 3/4 = 0.75 = 75%
- 1/8 = 0.125 = 12.5%
These conversions are crucial for accurate financial modeling, spreadsheet work, and understanding financial reports.
Percentages in Personal Finance and Budgeting
For individuals, percentages are an indispensable tool for managing daily finances, planning for the future, and making informed decisions about spending and saving.
Budgeting and Expense Tracking
Effective budgeting often involves allocating a certain percentage of your income to different categories. One popular method is the 50/30/20 rule: 50% of income for needs (housing, utilities, groceries), 30% for wants (entertainment, dining out), and 20% for savings and debt repayment. Using percentages makes this rule adaptable to any income level.
- Example: If your net monthly income is $4,000:
- Needs: 50% of $4,000 = $2,000
- Wants: 30% of $4,000 = $1,200
- Savings/Debt: 20% of $4,000 = $800
Tracking expenses as a percentage of income helps identify areas of overspending or opportunities to save more. Seeing that “dining out” accounts for 20% of your income might prompt you to adjust that spending category.
Understanding Loan Interest Rates
Perhaps one of the most significant financial applications of percentages in personal finance is understanding interest rates on loans and credit. Whether it’s a mortgage, car loan, or credit card, the interest rate—expressed as a percentage—determines the cost of borrowing.
- Annual Percentage Rate (APR): This is the annual rate charged for borrowing, or earned by investing, expressed as a percentage. It represents the actual yearly cost of funds over the term of a loan.
- Simple Interest: Calculated only on the principal amount of a loan or deposit.
- Interest = Principal * Rate * Time
- Compound Interest: The interest on a loan or deposit is calculated based on both the initial principal and the accumulated interest from previous periods. This is often referred to as “interest on interest” and is a powerful force for both debt growth and investment growth. Understanding the percentage rate and how it compounds is critical for evaluating long-term financial commitments.
A seemingly small difference in percentage points on a mortgage rate can translate into tens of thousands of dollars over the loan’s lifetime.
Discount Shopping and Sales Tax
Everyday transactions heavily rely on percentages. When a store advertises “30% off,” knowing how to quickly calculate that discount helps you determine the final price and judge the true value of the sale. Similarly, adding sales tax (a percentage) to a purchase is a routine calculation.
- Example: A pair of shoes costs $80, with a 20% discount and 7% sales tax.
- Discount: 20% of $80 = $16. New price = $80 – $16 = $64.
- Sales Tax: 7% of $64 = $4.48.
- Total Cost: $64 + $4.48 = $68.48.
These simple calculations empower consumers to manage their spending effectively and avoid surprises at the checkout.
Leveraging Percentages for Investment and Wealth Growth
For investors, percentages are the primary language for assessing performance, managing risk, and planning for long-term wealth accumulation.
Return on Investment (ROI)
ROI is a key performance indicator used to evaluate the efficiency or profitability of an investment. It is calculated as:
ROI = [(Current Value of Investment – Cost of Investment) / Cost of Investment] * 100
- Example: You invest $1,000 in a stock, and it grows to $1,200.
- ROI = [($1,200 – $1,000) / $1,000] * 100 = ($200 / $1,000) * 100 = 0.20 * 100 = 20%.
ROI allows investors to compare the profitability of different investments, regardless of their initial cost, providing a standardized measure of success.
Compounding Returns
The concept of compound interest, where returns generate further returns, is often called the “eighth wonder of the world.” Understanding how percentages drive this growth is fundamental to long-term investing. Even small percentage returns, compounded over many years, can lead to substantial wealth accumulation.
- Rule of 72: A quick way to estimate the number of years it takes for an investment to double at a given annual percentage rate (APR) is to divide 72 by the interest rate.
- If you earn 6% annually, your money will roughly double in 72 / 6 = 12 years.
This demonstrates the powerful effect of consistent percentage gains over time, making it crucial for retirement planning and long-term financial goals.
Portfolio Allocation and Risk Management
Investors use percentages to diversify their portfolios, allocating capital across different asset classes (stocks, bonds, real estate, cash) to manage risk and optimize returns. A common strategy might be 60% stocks and 40% bonds. As market values fluctuate, these percentages change, requiring rebalancing to maintain the desired risk profile.
- Example: An investor might target an allocation of 70% equities, 20% fixed income, and 10% alternative investments. Regularly monitoring the percentage breakdown allows them to adjust their holdings to stay aligned with their financial goals and risk tolerance.
Business Finance: Profitability and Growth Metrics
In the corporate world, percentages are the backbone of financial analysis, helping businesses understand their health, performance, and growth trajectory.
Profit Margins
Profit margins are critical indicators of a company’s financial robustness, showing what percentage of sales has turned into profit.
- Gross Profit Margin: Measures the percentage of revenue remaining after deducting the cost of goods sold (COGS).
- Gross Profit Margin = [(Revenue – COGS) / Revenue] * 100
- A high gross margin indicates efficient production.
- Operating Profit Margin: Shows the percentage of revenue left after paying for COGS and operating expenses (like salaries, rent, marketing).
- Operating Profit Margin = (Operating Income / Revenue) * 100
- Reflects the efficiency of core business operations.
- Net Profit Margin: The ultimate measure, indicating the percentage of revenue left after all expenses, including taxes and interest, have been deducted.
- Net Profit Margin = (Net Income / Revenue) * 100
- Represents the company’s overall profitability.
Comparing these percentages over time or against industry benchmarks provides invaluable insights into a business’s operational efficiency and financial health.
Growth Rates and Market Share
Businesses use percentages to track growth in various metrics: revenue growth, earnings growth, customer growth, and market share.
- Revenue Growth Rate: Measures the percentage increase in revenue over a period.
- Revenue Growth = [(Current Period Revenue – Prior Period Revenue) / Prior Period Revenue] * 100
- Market Share: The percentage of total sales in an industry generated by a particular company.
- Market Share = (Company’s Sales / Total Industry Sales) * 100
These percentages are vital for assessing a company’s competitive position and its ability to expand.
Financial Ratios
Many crucial financial ratios are expressed as percentages, providing a standardized way to analyze a company’s liquidity, solvency, efficiency, and profitability.
- Debt-to-Equity Ratio: While often expressed as a decimal, converting it to a percentage (e.g., 1.5 = 150%) clearly illustrates how much debt a company uses to finance its assets relative to shareholder equity.
- Current Ratio: Although usually a decimal, if a company’s current assets are, say, 150% of its current liabilities, it indicates strong short-term liquidity.
- Return on Assets (ROA) / Return on Equity (ROE): These are percentage-based metrics showing how efficiently a company uses its assets or equity to generate profit.
These percentage-based ratios are indispensable for investors, creditors, and management to make informed decisions about a company’s financial viability and future prospects.
Common Pitfalls and Advanced Percentage Concepts
While percentages seem straightforward, there are common mistakes and nuanced concepts that can trip up even experienced financial professionals.
Percentage Points vs. Percentage Change
This is a frequently confused distinction, especially in financial news and economic reports.
- Percentage Points: Refers to the absolute difference between two percentages.
- If an interest rate goes from 5% to 7%, it has increased by 2 percentage points.
- Percentage Change: Refers to the relative change between two percentages, calculated as a percentage of the original value.
- An increase from 5% to 7% is a 40% percentage change ([(7 – 5) / 5] * 100 = 40%).
- Understanding this difference is critical when interpreting financial data, as mixing them can lead to drastically different conclusions.
Understanding Basis Points
In specific financial contexts, particularly in bond markets and interest rate discussions, basis points (bps) are used. One basis point is equal to one-hundredth of a percentage point (0.01%) or 0.0001 in decimal form.
- Example: If a bond’s yield increases by 25 basis points, it means it increased by 0.25 percentage points (e.g., from 3.00% to 3.25%).
- Basis points allow for more precise discussion of small changes in interest rates, yields, and other financial percentages.
The Impact of Inflation
Inflation, expressed as an annual percentage rate, represents the rate at which the general level of prices for goods and services is rising, and subsequently, the purchasing power of currency is falling. Understanding inflation’s percentage impact is crucial for investment planning and preserving wealth.
- If your savings account yields 2% interest, but inflation is 3%, your real return is actually negative, meaning your purchasing power is eroding despite nominal gains.
- This percentage-based understanding is vital for selecting investments that can outpace inflation and protect long-term financial goals.
Conclusion
Percentages are far more than a simple mathematical concept; they are the lingua franca of finance, underpinning virtually every calculation, comparison, and analysis in personal and business financial management. From meticulously budgeting your household income and decoding the true cost of a loan, to shrewdly evaluating investment returns and dissecting a company’s profitability, a mastery of percentages empowers you to navigate the financial landscape with confidence and clarity.
By understanding what percentages represent, how to calculate them, and how they apply across different financial domains, you equip yourself with an invaluable skill set. This understanding enables more informed decisions, helps mitigate risks, and ultimately accelerates your journey towards financial literacy and success. Embrace percentages not as a daunting calculation, but as an essential tool for unlocking your full financial potential.
aViewFromTheCave is a participant in the Amazon Services LLC Associates Program, an affiliate advertising program designed to provide a means for sites to earn advertising fees by advertising and linking to Amazon.com. Amazon, the Amazon logo, AmazonSupply, and the AmazonSupply logo are trademarks of Amazon.com, Inc. or its affiliates. As an Amazon Associate we earn affiliate commissions from qualifying purchases.