
In the complex world of finance, numbers tell a story, but percentages provide the plot twist, the rising action, and the ultimate resolution. While raw figures offer a snapshot, percentages transform data into actionable intelligence, revealing relationships, comparing performance, and quantifying change in a universally understandable language. Far from being a mere mathematical exercise, “making percents” in a financial context means deriving, interpreting, and strategically applying these proportional values to illuminate everything from personal budgets and investment returns to business profitability and economic trends. For anyone seeking to master their financial destiny, understanding how to harness the power of percentages is not just a useful skill—it is an indispensable superpower.

This article delves into the art and science of “making percents” across the financial spectrum, guiding you from basic calculations to their profound implications in personal finance, investing, and business strategy.
The Foundational Power of Percents in Finance
At its core, a percentage is a fraction of 100, a standardized way to express a part of a whole. But in finance, this simple concept unlocks an incredible depth of understanding, allowing for clarity where raw numbers might only cause confusion.
Beyond Basic Arithmetic: The Language of Financial Health
Consider two different investments: one returned $500, the other $5,000. On the surface, the second seems vastly superior. However, if the first investment started with $1,000 and the second with $100,000, the story completely changes. The first investment yielded a 50% return ($500/$1,000), while the second returned only 5% ($5,000/$100,000). Percentages provide the context necessary to interpret financial performance accurately. They strip away the absolute scale, allowing us to focus on the relative impact, growth, or decline. This makes them the universal language for discussing financial health, whether it’s the percentage of your income going to debt, the percentage growth of a company’s revenue, or the percentage yield of a bond.
Normalizing Data for Clear Comparisons
One of the greatest strengths of percentages is their ability to normalize data. This means they put different data sets on an equal footing, regardless of their original magnitude. You can compare the profit margin of a small startup to that of a multinational corporation, the rate of inflation in two different countries, or the expense ratio of two distinct mutual funds. Without percentages, such comparisons would be like comparing apples and oranges, making informed decision-making virtually impossible. They allow financial professionals, investors, and individuals alike to benchmark performance, identify outliers, and detect trends that might otherwise remain obscured by large, disparate figures. This normalization is crucial for performance evaluation, risk assessment, and strategic planning.
Mastering the Art of Financial Percentage Calculation
While advanced financial modeling can involve complex algorithms, the foundational “making” of percents relies on a few straightforward calculations. Mastering these basics is the gateway to understanding and applying more sophisticated financial concepts.
Basic Percentage Calculation: The Core Formula
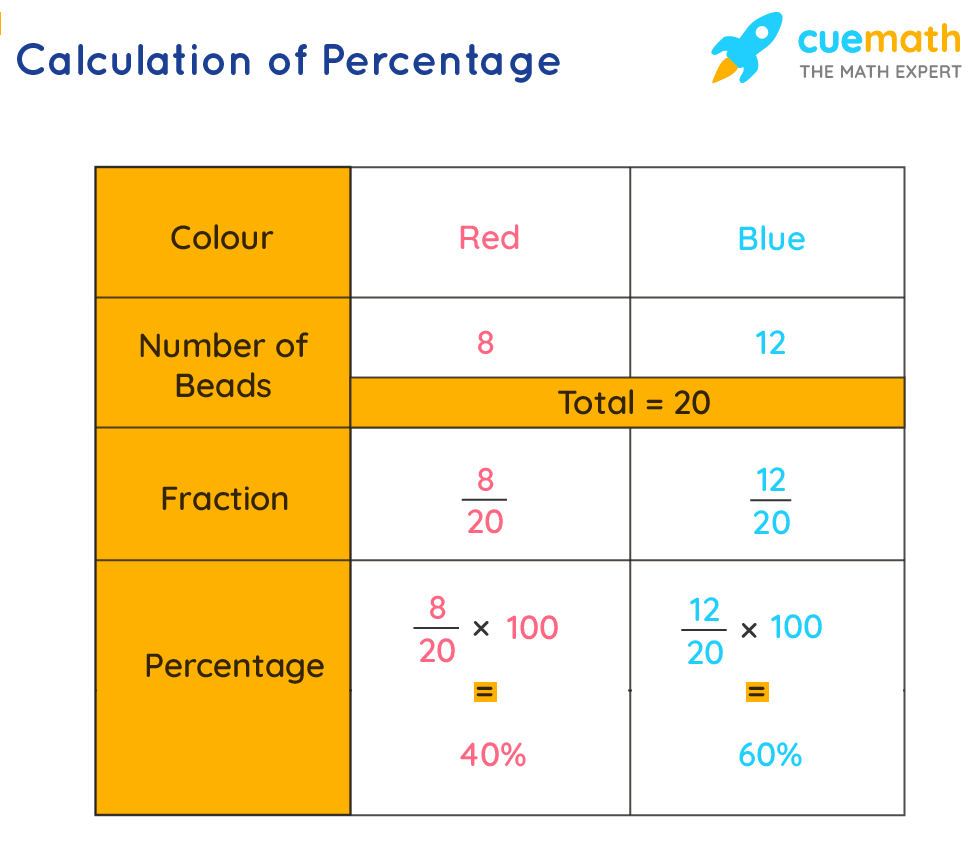
The most fundamental way to “make a percent” is to express a part as a proportion of a whole, then multiply by 100.
The formula is: (Part / Whole) × 100 = Percentage (%)
Example: If you spent $300 on groceries from a total monthly budget of $2,000, your grocery expense as a percentage of your budget is: ($300 / $2,000) × 100 = 15%. This simple calculation is the bedrock for everything from calculating tax rates to understanding discount percentages.
Percentage Increase and Decrease: Tracking Growth and Decline
Financial health is dynamic, constantly changing. Tracking growth or decline is essential for assessing performance over time.
The formula for Percentage Increase is: ((New Value – Old Value) / Old Value) × 100
The formula for Percentage Decrease is: ((Old Value – New Value) / Old Value) × 100
Example (Increase): If your stock investment grew from $10,000 to $12,500, the percentage increase is: (($12,500 – $10,000) / $10,000) × 100 = 25%.
Example (Decrease): If a company’s sales dropped from $500,000 to $450,000, the percentage decrease is: (($500,000 – $450,000) / $500,000) × 100 = 10%. These calculations are vital for analyzing investment returns, revenue growth, cost reductions, and market fluctuations.
Percentage of a Whole: Allocations and Distribution
Beyond simple parts and wholes, percentages are crucial for understanding how different components contribute to a larger sum, particularly in allocations. This is especially useful for understanding portfolio diversification, budget breakdowns, or cost structures within a business.
Example: In an investment portfolio worth $100,000, if you have $40,000 in stocks, $35,000 in bonds, and $25,000 in real estate, the allocation percentages are:
- Stocks: ($40,000 / $100,000) × 100 = 40%
- Bonds: ($35,000 / $100,000) × 100 = 35%
- Real Estate: ($25,000 / $100,000) × 100 = 25%
Understanding these distributions helps in assessing risk and ensuring your financial strategy aligns with your goals.
Applying Percents in Personal Finance Management
For the individual, percentages are the most powerful tool for taking control of their money, optimizing spending, managing debt, and building wealth. They translate complex financial concepts into digestible, actionable insights.
Budgeting by Percentages: The 50/30/20 Rule and Beyond
Rather than assigning rigid dollar amounts, percentage-based budgeting offers flexibility and adaptability. The popular 50/30/20 rule, for instance, suggests allocating 50% of your after-tax income to needs, 30% to wants, and 20% to savings and debt repayment. This framework allows individuals to scale their budget proportionally with income changes, maintaining financial discipline without constant recalculation. You can “make percents” for each spending category to see if you’re hitting your targets, helping you identify areas for adjustment and optimize your financial flow.

Understanding Interest Rates: The Cost of Borrowing and Earning
Interest rates, fundamentally expressed as percentages, are the lifeblood of lending and saving. Whether it’s the annual percentage rate (APR) on a credit card, the interest on a mortgage, or the yield on a savings account, these percentages dictate how much you pay for borrowed money or how much your savings grow. A seemingly small percentage difference can amount to thousands of dollars over time. Understanding how interest percentages compound—or accrue against you—is critical for making wise decisions about loans, credit, and savings vehicles.
Debt-to-Income Ratio: A Key Health Metric
Lenders often use the debt-to-income (DTI) ratio, expressed as a percentage, to assess your ability to manage monthly payments and repay debts. It’s calculated by dividing your total monthly debt payments by your gross monthly income. A DTI of 36% or lower is generally considered healthy. By regularly “making” and monitoring your DTI, you gain a clear picture of your financial leverage and can make informed decisions about taking on new debt or prioritizing debt reduction. This percentage serves as an early warning system for potential financial strain.
Leveraging Percents for Savvy Investing and Business Growth
In the realm of investing and business, percentages transcend simple measurement; they become the basis for evaluating performance, assessing profitability, and driving strategic decisions.
Return on Investment (ROI): Measuring Profitability
ROI is perhaps one of the most widely used percentage metrics in both investing and business. It measures the efficiency of an investment by comparing the gain or loss from an investment relative to its cost.
The formula: ((Net Profit from Investment – Cost of Investment) / Cost of Investment) × 100
A positive ROI indicates profitability, while a negative ROI signifies a loss. Investors use ROI to compare the effectiveness of different investment opportunities, from stocks and real estate to marketing campaigns and new product development. Businesses apply it to evaluate projects, asset purchases, and strategic initiatives, ensuring that capital is allocated efficiently to generate maximum returns.
Profit Margins: Gross, Operating, and Net
For businesses, “making” various profit margins as percentages offers a layered view of financial performance.
- Gross Profit Margin: (Gross Profit / Revenue) × 100. This percentage indicates how much money a company makes from its sales after accounting for the cost of goods sold.
- Operating Profit Margin: (Operating Income / Revenue) × 100. This percentage shows profitability after covering both the cost of goods sold and operating expenses (like salaries, rent, and utilities).
- Net Profit Margin: (Net Income / Revenue) × 100. This is the ultimate bottom line, revealing the percentage of revenue left after all expenses, including taxes and interest, have been paid.
Analyzing these percentages over time and against industry benchmarks allows businesses to diagnose inefficiencies, optimize pricing strategies, control costs, and ultimately drive sustainable growth.
Compound Interest: The Investor’s Best Friend
Often called the “eighth wonder of the world,” compound interest is the phenomenon where your investment earnings themselves earn interest. While the exact calculation is more complex, its power is fundamentally understood through percentages. A higher annual percentage yield (APY) compounded more frequently will lead to significantly greater returns over time. Understanding how to “make” (or project) the exponential growth potential of compound interest—even with small, consistent contributions and modest percentage returns—is foundational to long-term wealth building, particularly through retirement accounts and diversified portfolios.
Strategic Decision-Making with Percentage Insights
Beyond day-to-day management, percentages become critical tools for long-term financial planning, risk assessment, and strategic alignment in an ever-changing economic landscape.
Benchmarking and Performance Analysis
In competitive markets, understanding where you (or your business) stand relative to peers is invaluable. Percentage-based benchmarks, such as market share percentage, customer retention rate, or expense-to-revenue ratios, provide a clear framework for performance analysis. By “making” these percentages and comparing them against industry averages or top performers, individuals can optimize their financial habits, and businesses can identify competitive advantages or areas requiring strategic intervention to improve efficiency and market position.
Inflation and Purchasing Power: The Silent Eroder
Inflation, expressed as a percentage, measures the rate at which the general level of prices for goods and services is rising, and consequently, the purchasing power of currency is falling. Understanding the inflation percentage is vital for protecting your wealth. If your investments are not generating a percentage return higher than the inflation rate, your purchasing power is actually diminishing. This percentage insight informs decisions about asset allocation, necessary salary increases, and the urgency of saving for future goals.
Setting Financial Goals and Tracking Progress
Whether it’s saving 15% of each paycheck for retirement, aiming for a 7% annual return on your investment portfolio, or reducing your debt-to-income ratio by 5% each year, financial goals are often best articulated and tracked using percentages. These clear, quantifiable targets provide motivation and a tangible way to monitor progress. Regularly “making” and reviewing your financial percentages ensures you remain on track, allowing for timely adjustments to strategies and ultimately increasing the likelihood of achieving your long-term financial aspirations.
Conclusion
“How to make percents” is not just a query about calculation; it’s an exploration into the fundamental language of money. From personal budgeting to global investing, percentages provide clarity, enable comparison, and empower informed decision-making. They transform raw numbers into meaningful insights, allowing you to gauge financial health, assess performance, and plan for the future with confidence. Mastering the art of making, interpreting, and applying these powerful proportional values is not merely a mathematical skill; it is an essential financial literacy that empowers individuals and businesses alike to navigate the complex economic landscape, build wealth, and achieve their financial objectives. Embrace percentages, and you embrace a clearer, more strategic path to financial mastery.
aViewFromTheCave is a participant in the Amazon Services LLC Associates Program, an affiliate advertising program designed to provide a means for sites to earn advertising fees by advertising and linking to Amazon.com. Amazon, the Amazon logo, AmazonSupply, and the AmazonSupply logo are trademarks of Amazon.com, Inc. or its affiliates. As an Amazon Associate we earn affiliate commissions from qualifying purchases.