
Understanding percentages is a foundational skill, indispensable across nearly every facet of personal and business finance. From calculating a discount on a purchase to deciphering investment returns, budgeting, or analyzing profit margins, percentages provide a standardized way to express proportions, changes, and relationships that are vital for informed decision-making. Mastering how to determine a percent empowers individuals and businesses to navigate financial landscapes with greater clarity and precision.
Understanding the Fundamentals: What is a Percent?
At its core, a percentage is a way of expressing a number or ratio as a fraction of 100. The word “percent” originates from the Latin “per centum,” meaning “by the hundred.” It’s a universal language for comparison, allowing us to understand parts of a whole or rates of change in a readily digestible format, regardless of the absolute numbers involved.

The Core Concept: Part Over Whole
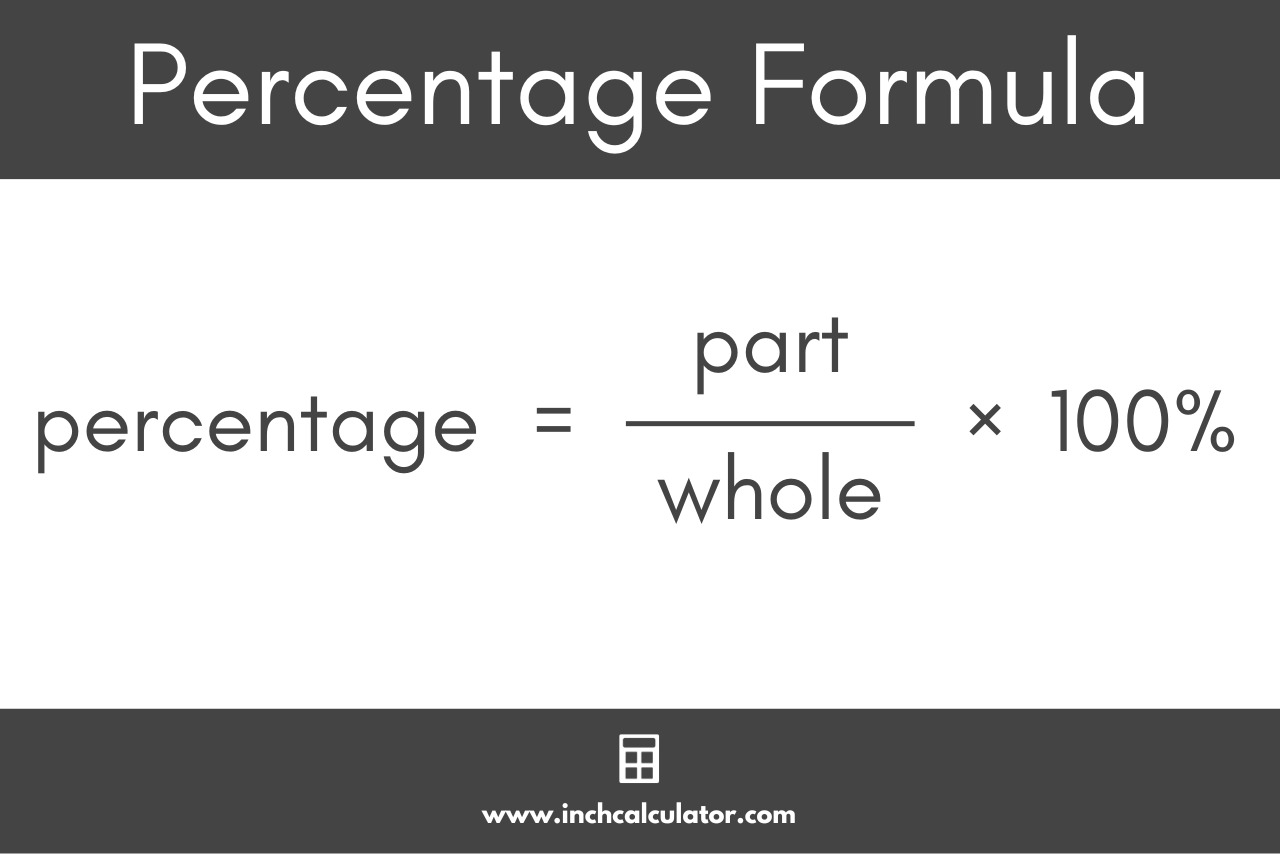
The most fundamental way to determine a percent involves identifying a “part” and a “whole.” The formula is deceptively simple:
Percent = (Part / Whole) x 100
Let’s break this down:
- Part: This is the specific amount or quantity you are interested in expressing as a percentage.
- Whole: This is the total amount, the base figure, or the sum against which the part is being compared.
For example, if you spent $300 on groceries from a total monthly budget of $2,000, the groceries are the “part,” and your total budget is the “whole.”
(300 / 2000) x 100 = 0.15 x 100 = 15%.
This means 15% of your budget goes to groceries, offering an immediate insight into your spending habits.
The Decimal Connection
Before multiplying by 100, the division of the part by the whole yields a decimal. This decimal represents the proportion of the whole that the part constitutes. Converting decimals to percentages and vice-versa is a critical skill.
- Decimal to Percent: Multiply the decimal by 100 and add the percent symbol (%). E.g., 0.15 becomes 15%.
- Percent to Decimal: Divide the percentage by 100. E.g., 25% becomes 0.25.
This interchangeability is crucial when working with formulas in spreadsheets or financial calculators, where percentages often need to be input as their decimal equivalents.
Why Percentages Matter in Finance
In the financial world, percentages provide context and comparability. An investment gain of $1,000 might seem significant, but if it came from a $100,000 initial investment, it’s a 1% return. If it came from a $10,000 investment, it’s a 10% return. The percentage clearly illustrates the efficiency and performance, allowing for meaningful comparisons across different investment sizes or timeframes. Similarly, a 5% increase in revenue for a small business is a different story than a 5% increase for a multinational corporation, but the percentage itself provides a common metric for evaluating growth.
Practical Applications: Calculating Key Financial Percentages
The basic formula for determining percent forms the backbone for a myriad of financial calculations. Understanding these applications is key to managing personal finances, making informed investment decisions, and running a successful business.
Calculating Discounts and Markups
Discounts and markups are among the most common everyday applications of percentages.
- Discount: To calculate a discounted price, first find the discount amount.
- Discount Amount = Original Price x Discount Rate (as a decimal)
- Final Price = Original Price – Discount Amount
For example, a $50 item with a 20% discount:
Discount Amount = $50 x 0.20 = $10
Final Price = $50 – $10 = $40
- Markup: Businesses use markups to set selling prices.
- Markup Amount = Cost Price x Markup Rate (as a decimal)
- Selling Price = Cost Price + Markup Amount
If a product costs $30 to produce and a business applies a 50% markup:
Markup Amount = $30 x 0.50 = $15
Selling Price = $30 + $15 = $45
Determining Interest Rates and Returns on Investment (ROI)
Interest rates and ROI are pivotal for saving, borrowing, and investing.
- Interest Rates: Whether it’s the interest earned on a savings account or the interest paid on a loan, it’s typically expressed as an annual percentage.
- Interest Amount = Principal x Interest Rate (as a decimal) x Time (in years)
If you borrow $10,000 at a 5% annual interest rate for one year:
Interest Amount = $10,000 x 0.05 x 1 = $500
- Interest Amount = Principal x Interest Rate (as a decimal) x Time (in years)
- Return on Investment (ROI): ROI measures the profitability of an investment relative to its cost.
- ROI = ((Current Value of Investment – Original Cost of Investment) / Original Cost of Investment) x 100
If you invested $5,000 in stocks and they are now worth $6,000:
ROI = (($6,000 – $5,000) / $5,000) x 100 = ($1,000 / $5,000) x 100 = 0.20 x 100 = 20%
- ROI = ((Current Value of Investment – Original Cost of Investment) / Original Cost of Investment) x 100

Analyzing Budget Proportions
Budgeting involves allocating income across various spending categories. Percentages help visualize where money goes and identify areas for adjustment.
- Percentage of Income for a Category = (Amount Spent in Category / Total Income) x 100
If your monthly income is $4,000 and you spend $1,200 on housing:
Housing Percentage = ($1,200 / $4,000) x 100 = 0.30 x 100 = 30%
This percentage immediately tells you if you’re adhering to common budgeting guidelines, like the 50/30/20 rule (50% needs, 30% wants, 20% savings/debt repayment).
Understanding Profit Margins and Growth Rates
For businesses, percentages are fundamental to assessing financial health and performance.
- Gross Profit Margin: Measures the percentage of revenue left after deducting the cost of goods sold.
- Gross Profit Margin = ((Revenue – Cost of Goods Sold) / Revenue) x 100
If a company has $100,000 in revenue and $60,000 in cost of goods sold:
Gross Profit Margin = (($100,000 – $60,000) / $100,000) x 100 = ($40,000 / $100,000) x 100 = 0.40 x 100 = 40%
- Gross Profit Margin = ((Revenue – Cost of Goods Sold) / Revenue) x 100
- Sales Growth Rate: Indicates how much sales have increased over a period.
- Sales Growth Rate = ((Current Period Sales – Previous Period Sales) / Previous Period Sales) x 100
If sales were $50,000 last year and $60,000 this year:
Sales Growth Rate = (($60,000 – $50,000) / $50,000) x 100 = ($10,000 / $50,000) x 100 = 0.20 x 100 = 20%
- Sales Growth Rate = ((Current Period Sales – Previous Period Sales) / Previous Period Sales) x 100
Beyond Basic Calculations: Advanced Considerations
While the “part over whole” formula is foundational, financial analysis often requires a deeper understanding of percentage concepts, particularly when tracking changes over time or dealing with compound effects.
Percentage Change: Tracking Financial Evolution
Distinguishing between a simple percentage and a percentage change is crucial. Percentage change measures the relative shift between two values over time.
- Percentage Change = ((New Value – Old Value) / Old Value) x 100
This formula is versatile, applicable to tracking changes in stock prices, inflation rates, salary increases, or even the value of your assets. A positive result indicates a percentage increase, while a negative result signifies a percentage decrease. For instance, if your investment account grew from $10,000 to $11,000:
Percentage Change = (($11,000 – $10,000) / $10,000) x 100 = ($1,000 / $10,000) x 100 = 0.10 x 100 = 10% increase.
Percentage Point vs. Percentage Change
A common area of confusion is the difference between a “percentage point” and a “percentage change.” This distinction is particularly important when discussing interest rates, economic data, or survey results.
- Percentage Point: This refers to the arithmetic difference between two percentages. If an interest rate increases from 4% to 5%, that’s a 1 percentage point increase (5% – 4% = 1%).
- Percentage Change: This refers to the relative change. An increase from 4% to 5% is a 25% increase in the interest rate itself ( (5-4)/4 * 100 = 25%).
Understanding this difference is vital for accurate interpretation of financial news and data.
The Power of Compound Percentages
In investing and debt, percentages don’t always operate in isolation; they often compound. Compound interest, for example, means earning interest not just on the initial principal but also on the accumulated interest from previous periods. This exponential growth (or debt) is a powerful concept.
The formula for compound interest is:
A = P (1 + r/n)^(nt)
Where:
- A = the future value of the investment/loan, including interest
- P = the principal investment amount (the initial deposit or loan amount)
- r = the annual interest rate (as a decimal)
- n = the number of times that interest is compounded per year
- t = the number of years the money is invested or borrowed for
Understanding how to determine the impact of compounding percentages is fundamental to long-term financial planning, whether for retirement savings or managing credit card debt. Even small percentage differences in interest rates can lead to vastly different outcomes over extended periods due to compounding.
Tools and Tips for Accurate Percent Calculations
While the underlying math is straightforward, accurately determining percentages in real-world financial scenarios often benefits from the right tools and habits.
Leveraging Spreadsheets and Financial Calculators
For complex calculations, particularly those involving large datasets, multiple variables, or compounding over time, spreadsheets (like Microsoft Excel or Google Sheets) are invaluable. They allow you to set up formulas once and apply them across numerous entries, minimizing errors. Most spreadsheet programs have a built-in “percentage” format and functions that simplify calculations, such as automatically converting decimals to percentages. Similarly, dedicated financial calculators can streamline complex interest and investment calculations.
Double-Checking Your Work
Even with tools, errors can occur. Always take a moment to sanity-check your results. Does the percentage make logical sense in the given context? If you calculated a 150% discount, you know something went wrong. A quick mental estimate or a reverse calculation can often catch significant mistakes before they lead to poor financial decisions.
The Importance of Context
Finally, while knowing how to determine a percent is essential, understanding the context in which it’s applied is equally critical. A 10% return on investment might be excellent in a low-interest-rate environment but mediocre during a bull market. A 3% inflation rate needs to be viewed in light of wage growth. Percentages are powerful metrics, but their true meaning is derived from the broader financial and economic context in which they exist. Mastering both the calculation and the interpretation unlocks the full potential of this fundamental financial tool.
aViewFromTheCave is a participant in the Amazon Services LLC Associates Program, an affiliate advertising program designed to provide a means for sites to earn advertising fees by advertising and linking to Amazon.com. Amazon, the Amazon logo, AmazonSupply, and the AmazonSupply logo are trademarks of Amazon.com, Inc. or its affiliates. As an Amazon Associate we earn affiliate commissions from qualifying purchases.