In the dynamic world of money, understanding change is not just useful, it’s essential. Whether you’re a seasoned investor tracking your portfolio, a meticulous budgeter analyzing your spending habits, or a business owner assessing revenue growth, the ability to quantify shifts is paramount. Simply knowing that a value has increased or decreased isn’t enough; to truly grasp the impact and make informed decisions, you need to understand the magnitude of that change relative to its starting point. This is where the percentage of change comes in—a powerful, versatile metric that provides invaluable context to any financial alteration.
This guide will demystify the calculation of percentage of change, walking you through its fundamental formula, exploring its myriad applications across personal and business finance, and highlighting key considerations to ensure accurate and insightful analysis. By mastering this simple yet profound calculation, you’ll equip yourself with a critical tool for navigating the complexities of your financial journey.
Understanding the Core Concept of Percentage Change
At its heart, percentage change is a mathematical tool designed to express the relative change between two values over time. It transforms absolute differences into a standardized, easily comparable metric that tells you not just how much something changed, but how much it changed in proportion to its original size. This proportionality is what makes it so incredibly powerful in financial analysis.
What is Percentage Change?
Percentage change quantifies the degree of change over time, showing the increase or decrease in a value relative to its initial amount. It’s expressed as a percentage, making it intuitive to understand and compare across different scenarios, regardless of the absolute values involved. For instance, a $100 increase in a $1,000 investment represents a very different growth story than a $100 increase in a $10 investment. Percentage change clarifies this distinction.
Why is it Important in Finance?
In the realm of money, percentage change serves as a universal translator for performance, growth, and decline. Without it, financial data can be misleading or difficult to interpret.
- Comparison: It allows for apples-to-apples comparisons. You can compare the growth of two different stocks, the effectiveness of two different marketing campaigns, or the change in your utility bill from one month to the next, even if the absolute values are vastly different.
- Context: A $50 increase in your daily coffee spending might seem negligible, but if your daily coffee budget was only $5, that’s a 1000% increase – a significant context change. Percentage change provides this crucial context.
- Decision Making: By understanding the relative impact of changes, individuals and businesses can make more strategic decisions. Should you invest more in a stock that grew 20% or one that grew 5%? Is a 15% increase in expenses alarming or expected given a corresponding revenue increase?
- Trend Analysis: Over time, tracking percentage changes helps identify trends, predict future outcomes, and adjust strategies accordingly.
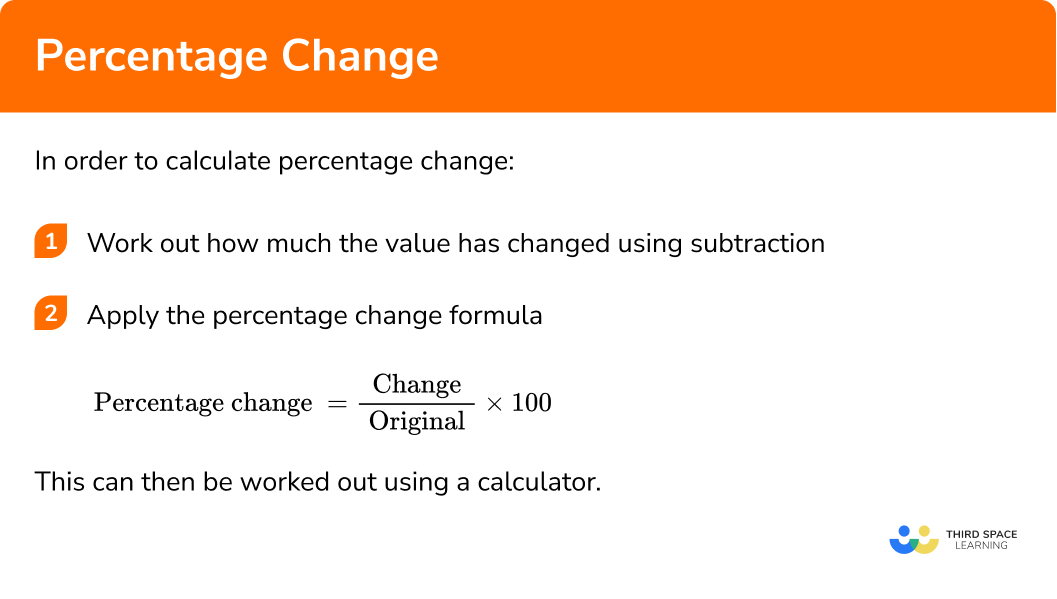
The Fundamental Formula: A Step-by-Step Guide
Calculating the percentage of change is straightforward, involving a simple four-step process. The core idea is to find the difference between the new and old values, divide that difference by the old value, and then convert the result into a percentage.
The formula is:
Percentage Change = [(New Value – Old Value) / Old Value] * 100
Let’s break down each step.
Step 1: Identify Initial and Final Values
Before you can calculate anything, you need to clearly define the two points you are comparing.
- Old Value (or Initial Value): This is the starting point, the baseline against which you are measuring the change. It could be last month’s spending, the stock price at the beginning of the year, or last quarter’s revenue.
- New Value (or Final Value): This is the ending point, the value after the change has occurred. It could be this month’s spending, the current stock price, or this quarter’s revenue.
Accuracy here is critical. Using the wrong initial or final value will naturally lead to an incorrect percentage change.
Step 2: Calculate the Absolute Change
The first part of the formula involves finding the raw difference between the two values:
Absolute Change = New Value – Old Value
- If the New Value is greater than the Old Value, the result will be a positive number, indicating an increase.
- If the New Value is less than the Old Value, the result will be a negative number, indicating a decrease.
Example: If your investment started at $1,000 (Old Value) and is now $1,200 (New Value):
Absolute Change = $1,200 – $1,000 = $200
Step 3: Divide by the Initial Value
Now, take the absolute change you just calculated and divide it by the Old Value:
Relative Change = Absolute Change / Old Value
This step normalizes the change, expressing it as a decimal or fraction relative to the original amount. This is where the context is introduced.
Example (continuing from above):
Relative Change = $200 / $1,000 = 0.20
Step 4: Convert to a Percentage
The final step is to convert this decimal into a percentage, making it easily understandable:
Percentage Change = Relative Change * 100
This expresses the change out of 100 parts, making it universally comparable.
Example (continuing from above):
Percentage Change = 0.20 * 100 = 20%
This means your investment increased by 20%.
Navigating Positive and Negative Changes
The sign of the result is crucial for interpretation:
- Positive Percentage Change: Indicates an increase in value. (e.g., +20% growth)
- Negative Percentage Change: Indicates a decrease in value. (e.g., -15% decline)

When discussing decreases, it’s common to say “decreased by 15%” rather than “a -15% change,” but mathematically, they represent the same concept.
Practical Applications in Personal Finance and Investing
The percentage of change is not merely an academic exercise; it’s a practical tool that empowers individuals to manage their personal finances and investments with greater insight.
Tracking Investment Performance
One of the most common applications is evaluating how well your investments are doing.
- Stock Gains/Losses: If you bought a stock at $50 and it’s now $55, that’s a ([55-50]/50)100 = 10% gain. If it dropped to $45, it’s a ([45-50]/50)100 = -10% loss.
- Portfolio Growth: You can track the overall percentage growth of your entire investment portfolio over a quarter, year, or decade, providing a clear picture of your wealth accumulation.
Analyzing Budget Variances
For disciplined budgeters, percentage change is invaluable for understanding spending patterns.
- Month-to-Month Spending: If your grocery bill was $400 last month and $450 this month, that’s a ([450-400]/400)*100 = 12.5% increase. This helps you identify areas where spending is creeping up and make necessary adjustments.
- Category Performance: Track changes in specific spending categories (e.g., entertainment, transportation) to ensure they align with your financial goals.
Evaluating Salary Increases or Decreases
When you get a raise, or in unfortunate circumstances, a pay cut, percentage change helps you understand its real impact.
- Salary Growth: A $5,000 raise on a $50,000 salary is a 10% increase. The same $5,000 raise on a $100,000 salary is only a 5% increase. This clarifies the relative improvement in your income.
Assessing Inflation and Cost of Living
Understanding how prices change over time is crucial for maintaining purchasing power.
- Price Hikes: If a basket of goods cost $100 last year and $103 this year, that’s a 3% inflation rate, indicating a decrease in your money’s buying power.
- Rental Increases: A 5% increase in your rent can significantly impact your budget, and percentage change quantifies this impact precisely.
Mortgage and Loan Interest Rate Changes
While often presented as absolute points, understanding percentage change can add perspective. If an interest rate goes from 4% to 4.2%, it might seem small, but the percentage increase is actually 5% ([4.2-4]/4)*100. This could have a noticeable impact on monthly payments over the long term.
Business Finance Insights through Percentage Change
For businesses, from startups to multinational corporations, percentage change is a cornerstone of financial reporting, strategic planning, and performance evaluation. It helps stakeholders interpret financial statements and make critical business decisions.
Revenue and Profit Growth/Decline
These are perhaps the most vital metrics for any business.
- Revenue Growth: Comparing current quarter’s revenue to the previous quarter’s or last year’s helps assess market reception, sales strategies, and overall business expansion. A 20% year-over-year revenue growth is a strong indicator of success.
- Profitability Trends: Tracking the percentage change in net profit highlights the efficiency of operations and pricing strategies. A higher percentage profit growth than revenue growth indicates improved efficiency.
Expense Management and Cost Savings
Businesses constantly seek to optimize costs.
- Operational Expenses: Analyzing the percentage change in various expenses (e.g., marketing, administrative, production costs) helps identify areas for potential savings or where costs are spiraling out of control. A sudden 15% increase in utility costs might warrant investigation.
- Cost of Goods Sold (COGS): Understanding the percentage change in COGS relative to sales growth is crucial for maintaining healthy gross margins.
Market Share Analysis
For businesses operating in competitive markets, understanding their position is key.
- Market Share Shifts: If a company’s market share increases from 10% to 12%, that’s a 20% increase in its market presence (not just a 2 percentage point increase). This tells a much more compelling story of competitive success.
Inventory Turnover and Sales Growth
Operational efficiency metrics often benefit from percentage change analysis.
- Inventory Levels: A significant percentage decrease in inventory turnover might signal overstocking or slowing sales.
- Sales Conversion Rates: If a website’s conversion rate increases from 2% to 2.5%, that’s a 25% increase in effectiveness ([2.5-2]/2)*100, which can significantly boost revenue.
Impact of Economic Indicators
Businesses must operate within the broader economic context.
- GDP Growth: Understanding the percentage change in Gross Domestic Product helps businesses forecast demand and economic conditions.
- Unemployment Rates: Changes in unemployment can indicate shifts in consumer spending power and labor availability.
Common Pitfalls and Advanced Considerations
While the percentage change formula is simple, its application requires careful thought to avoid misinterpretation.
The Base Value Trap
Always ensure you are using the correct initial value as the denominator. A common mistake is to calculate the percentage change based on a different or incorrect starting point. For instance, if something goes from $10 to $0, and then back to $10, calculating the percentage change from $0 to $10 is mathematically undefined (division by zero). In such cases, absolute change or different metrics might be more appropriate. When dealing with percentages of percentages, clarify whether you are referring to percentage point change or percentage relative change. For example, a mutual fund’s expense ratio increasing from 1% to 1.1% is a 0.1 percentage point increase, but a 10% relative increase in the expense ratio.
Averaging Percentages
Be cautious when averaging percentage changes, especially over different base values or time periods. For example, if a stock gains 50% in year one and loses 50% in year two, it does not mean it returned 0% over two years. A $100 investment goes to $150 (50% gain) and then to $75 (50% loss from $150). The overall change is a -25%. Compounding effects must be considered.
Compounding vs. Simple Change
For changes over multiple periods, it’s crucial to distinguish between simple and compound growth. Simple percentage change looks at the change from an initial point to a final point, regardless of intermediate fluctuations. Compound annual growth rate (CAGR) is used to smooth out volatile growth rates and provide an average annual growth rate over multiple periods, assuming the profits are reinvested. This is especially relevant in investment analysis.
Normalization and Context
A small percentage change in a very large number can represent a massive absolute change (e.g., 0.1% change in national GDP). Conversely, a large percentage change in a very small number might be negligible in absolute terms (e.g., 500% growth in a side hustle that only made $10 to begin with). Always consider the absolute values alongside the percentages for a complete picture. Context is king.
Conclusion
The ability to calculate and interpret the percentage of change is an indispensable skill in any financial toolkit. From meticulously managing personal budgets and tracking investment returns to analyzing critical business performance indicators, this simple formula provides the clarity and context needed to make astute financial decisions. It transforms raw numbers into meaningful insights, allowing you to compare, assess, and strategize with confidence.
By understanding its mechanics, applying it judiciously across various financial scenarios, and being mindful of common pitfalls, you can leverage percentage of change to gain a deeper, more nuanced understanding of the financial landscape around you. Embrace this powerful metric, and empower yourself to navigate the ever-evolving world of money with greater precision and foresight.
aViewFromTheCave is a participant in the Amazon Services LLC Associates Program, an affiliate advertising program designed to provide a means for sites to earn advertising fees by advertising and linking to Amazon.com. Amazon, the Amazon logo, AmazonSupply, and the AmazonSupply logo are trademarks of Amazon.com, Inc. or its affiliates. As an Amazon Associate we earn affiliate commissions from qualifying purchases.